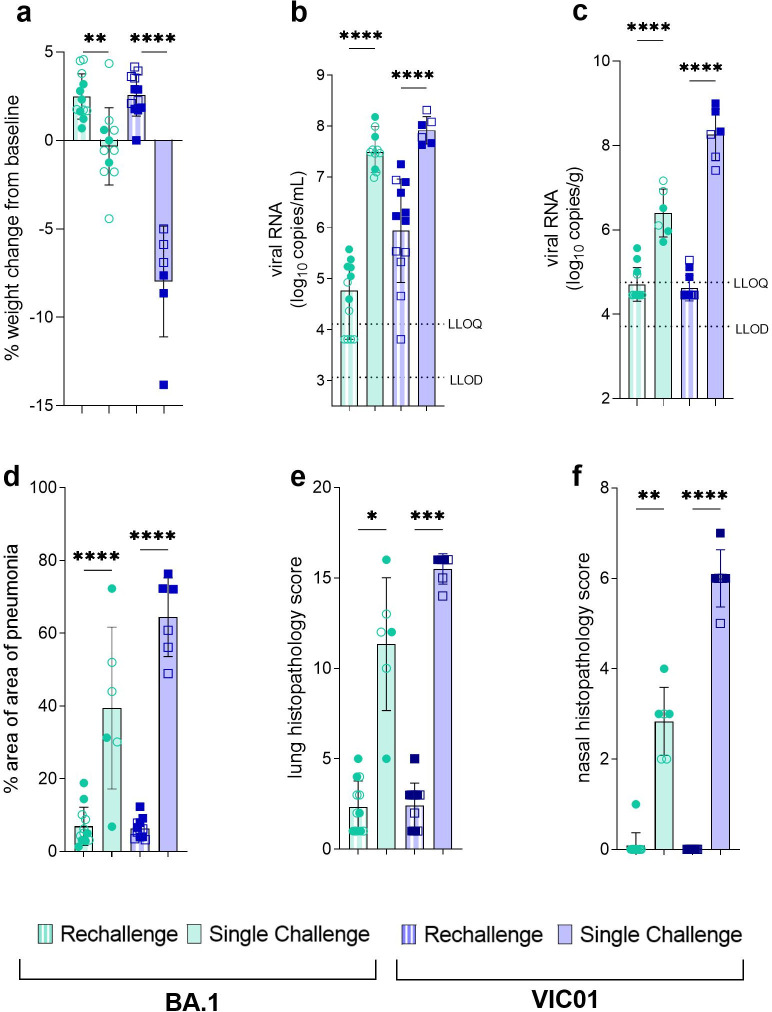
Fig 6.
BA.1 offers sufficient discriminatory power for evaluation of BA.1-specific countermeasures (a) At 7 days post infection there was a significant difference in percent weight change between BA.1 single infection and rechallenge hamsters (P = 0.0021) and VIC01 single infection and rechallenge hamsters (P<0.0001). Statistical analysis between groups was carried out using one-way ANOVA. (b) Total viral RNA in throat swabs at 2 days post infection was quantified by RT-qPCR. Bars show group mean and error bars show standard deviation. The dashed horizontal lines show the lower limit of quantification (LLOQ) and the lower limit of detection (LLOD). A significant difference was seen between BA.1 single infection and rechallenge (P<0.0001) and between VIC01 single infection and rechallenge (P = <0.0001) groups. Statistical analysis between groups was carried out using one-way ANOVA. (c) Total viral RNA in the lung at 7 days post infection was quantified by RT-qPCR. Bars show group mean and error bars show standard deviation. The dashed horizontal lines show the lower limit of quantification (LLOQ) and the lower limit of detection (LLOD). Significantly less virus was found in the lungs of BA.1 and VIC01 rechallenge animals (both<0.0001) compared to single infection. Statistical analysis between groups was carried out using one-way ANOVA. (d) Percentage area of pneumonia was significantly less in both rechallenge groups compared to single infection groups (both P<0.0001). Statistical analysis between groups was carried out using one-way ANOVA. (e) Lung and (f) nasal cavity scores were significantly reduced in BA.1 (P = 0.0144, P = 0.0081) and VIC01 (P = 0.0007, P<0.001) rechallenge hamsters compared to those that received single infection. Statistical analysis between groups was carried out using Kruskal-Wallis.

