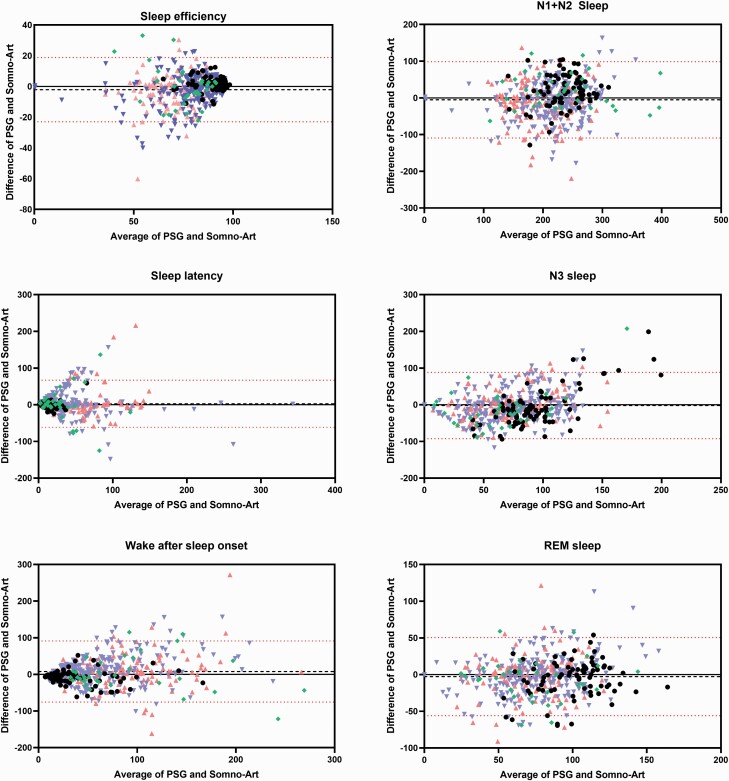
Figure 1.
Bland-Altman plots for sleep efficiency, sleep latency, wake after sleep onset, N1 + N2, N3, and REM sleep.
Bias and lower and upper LoA between PSG and Somno-Art Software of the overall group are represented (n = 458). Black dots represent the healthy group (n = 79), green diamond OSA patients (n = 33), pink upward triangle insomniac patients (n = 135), and blue downward triangle MDD patients (n = 211).

