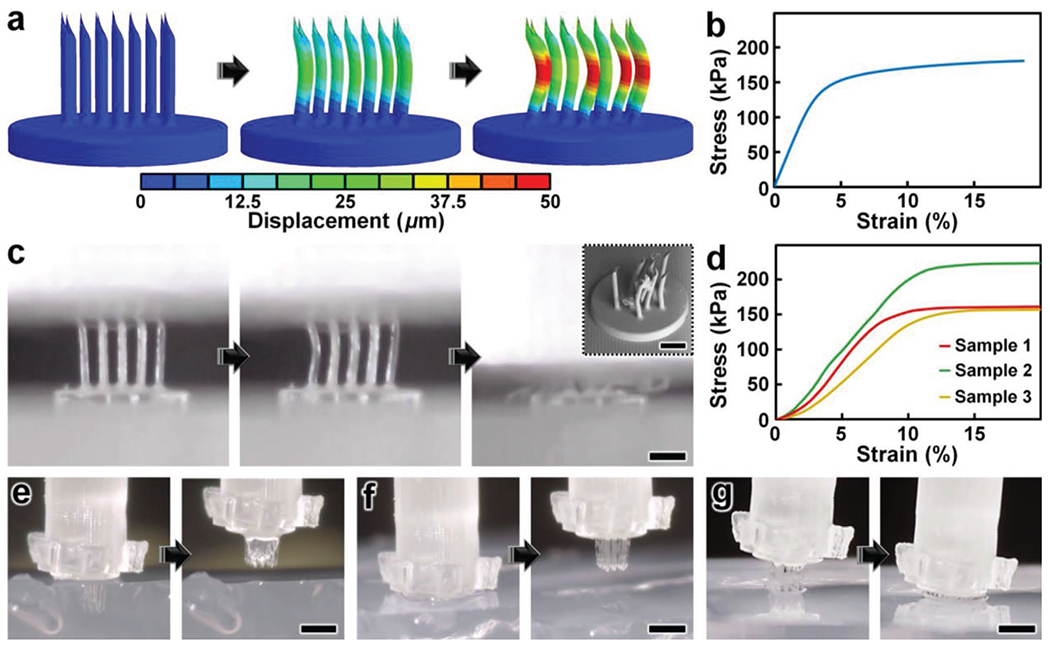
Figure 3.

Numerical and experimental results for MNA mechanical characterizations. a,b) Finite element analysis (FEA) results for a) microneedle deformations and b) stress-strain curve corresponding to MNA mechanics under compressive loading conditions. c,d) Experimental results for MNA compression testing. c) Sequential images of the MNA during axial compression test. Inset shows an SEM image of an MNA following compressive failure. Scale bars = 250 μm (see Movie S4 in the Supporting Information). d) Stress–strain curve generated from compressive loading experiments (n = 3 MNAs). e–g) Sequential images of representative MNA penetration and retraction operations corresponding to hydrogels with agarose concentrations of: e) 2.4%, f) 5%, and g) 10%. Scale bars = 500 μm (see Movie S5 in the Supporting Information).
