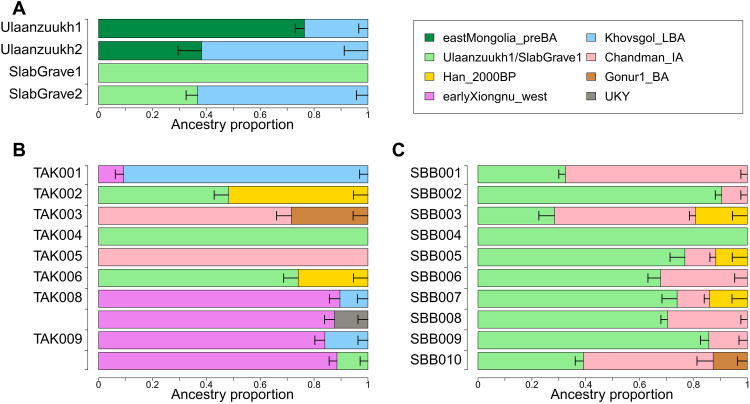
Fig. 2. qpAdm modeling of TAK and SBB individuals.
The genetic profiles of ancient individuals are modeled as the mixture of two or three populations. The ancestry proportion of each source population is represented by the size of the box on the x axis. Horizontal bars represent ±1 SE estimated by qpAdm using 5-cM block jackknifing. Detailed results are presented in data file S2. (A) Ulaanzuukh and SlabGrave individuals are modeled as the mixture between Ancient Northeast Asian (ANA), represented by eastMongolia_preBA in this study, and Khovsgol_LBA. We modeled Takhiltyn Khotgor (TAK) (B) and Shombuuzyn Belchir (SBB) (C) individuals as the mixture of the preceding groups from Mongolia and the surrounding regions: SlabGrave1, Chandman_IA, Han_2000BP, Gonur1_BA, earlyXiongnu_west, Khovsgol_LBA, and UKY. We present two models for TAK008 and TAK009.

