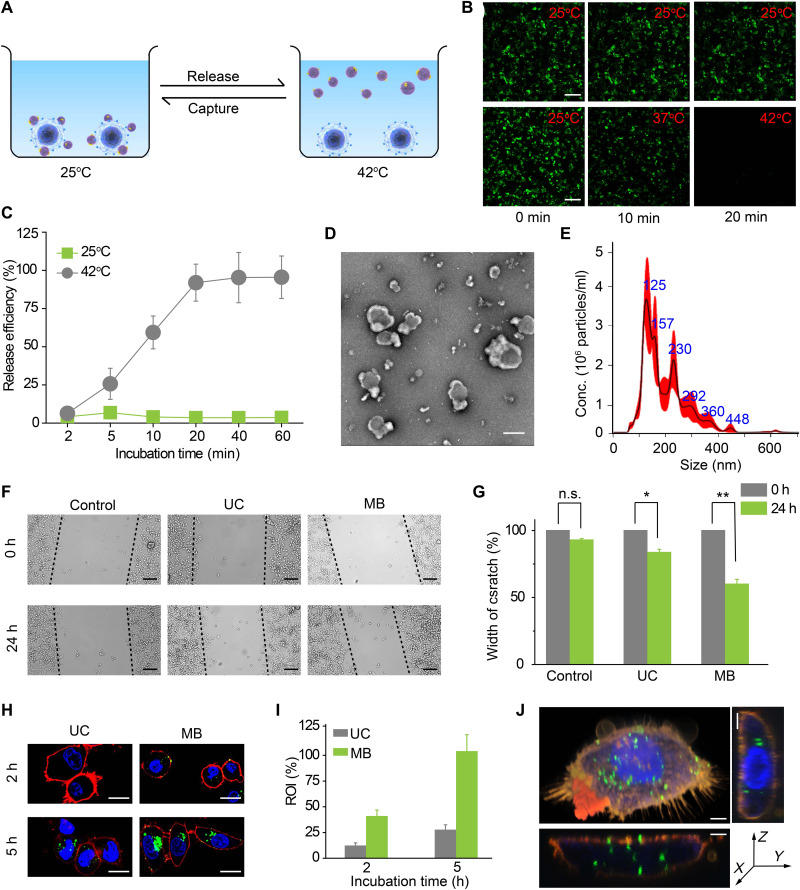
Fig. 2. Temperature-mediated release of EVs from MB (denote as MB@CP-iPr here).
(A) Schematic illustration of the temperature-responsive release of SW620 EVs from MB@CP-iPr. (B) Fluorescence images showing the release of EVs from MB@CP-iPr after temperature increase from 25°C to 42°C. Scale bar, 20 μm. (C) The time-dependent release efficiencies of EVs from MB@CP-iPr in (B). Error bars denote mean ± SEM (n = 3). (D) Typical morphology of the EVs characterized by cryo-EM image (scale bar, 100 nm) and (E) size distribution of the EVs measured by NTA. (F) Wound healing assay of SW480 cells incubated with SW620 EVs isolated by UC and MB, respectively. Migration was assessed at 24-hour time point after wounding. The absence of SW620 EVs was set as control. Scale bars, 50 μm. (G) Width of the scratches from the different groups in (F). Error bars denote mean ± SEM (n = 3; n.s., not significant; P > 0.05, *P < 0.05, and **P < 0.01; two-tailed t test.). (H) Confocal images of SW480 cells after incubating with SW620 EVs isolated by UC and MB for 2 and 5 hours, respectively. Blue, Hoechst 33343; green, EVs-DiO); red, DiI. Scale bars, 10 μm. (I) Cell uptake efficiencies were determined by calculating the region of interest (ROI) of the green signals with ImageJ software. The ROI of MB group at 5 hours was set at 100%. Error bars denote mean ± SEM (n = 3). (J) 3D confocal images of a SW480 cell after incubating with SW620 EVs isolated by MB. Blue, Hoechst 33343; green, EVs-DiO; and red, DiI). Scale bars, 2 μm. h, hours.

