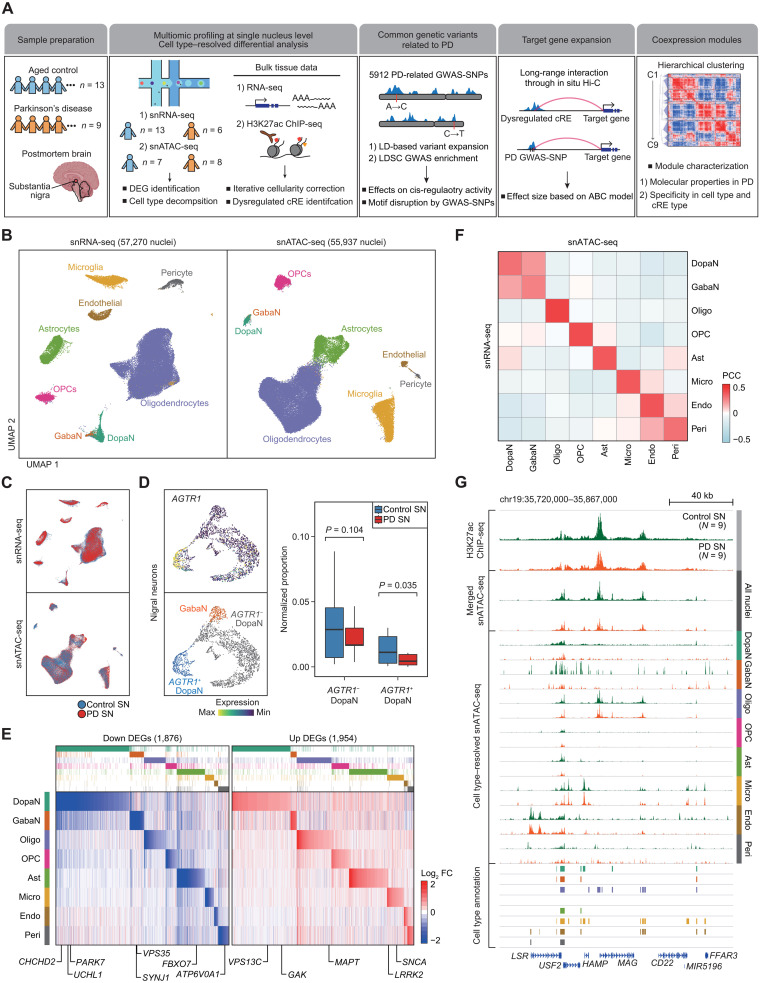
Fig. 1. Single-nucleus profiling of transcriptomic and epigenomic landscape in the human SN.
(A) A schematic of the study design, illustrating the preparation of sequencing-based omics data and downstream computational analysis. (B) Uniform Manifold Approximation and Projection (UMAP) embeddings of quality control–passed nuclei for snRNA-seq (left) and snATAC-seq (right). The nuclei were annotated into dopaminergic neurons (DopaNs), GABAergic neurons (GabaN), oligodendrocytes (Oligo), oligodendrocyte precursor cells (OPCs), astrocytes (Ast), microglia (Micro), endothelial cells (Endo), and pericytes (Peri), based on cell type markers. (C) UMAP embeddings of nuclei colored by pathological status, where red and blue indicate nuclei from PD and control SN, respectively. (D) UMAP embeddings of nigral neurons illustrating sub-DopaN populations with or without the expression of AGTR (left), along with box plots showing the normalized nucleus proportion of AGTR+ and AGTR− DopaNs between control and PD cases based on snRNA-seq data. (E) A heatmap by log2 fold change (FC) of cell type–resolved snRNA-seq reads (PD/control), illustrating 1876 down-regulated DEGs (left) and 1954 up-regulated DEGs (right), with the annotation of known PD risk genes. (F) A heatmap showing Pearson’s correlation coefficients (PCC) between snATAC-seq gene activity scores and snRNA-seq gene expression across the cell types present in the human SN. (G) Genome browser tracks of H3K27ac ChIP-seq signals and pseudo-bulk snATAC-seq signals resolved according to each cell type for PD (red) and control (green) groups, along with tracks indicating the positions of cell type–resolved cREs. The signals for ChIP-seq and cell type–resolved snATAC-seq were normalized by the total reads mapped in cREs.

