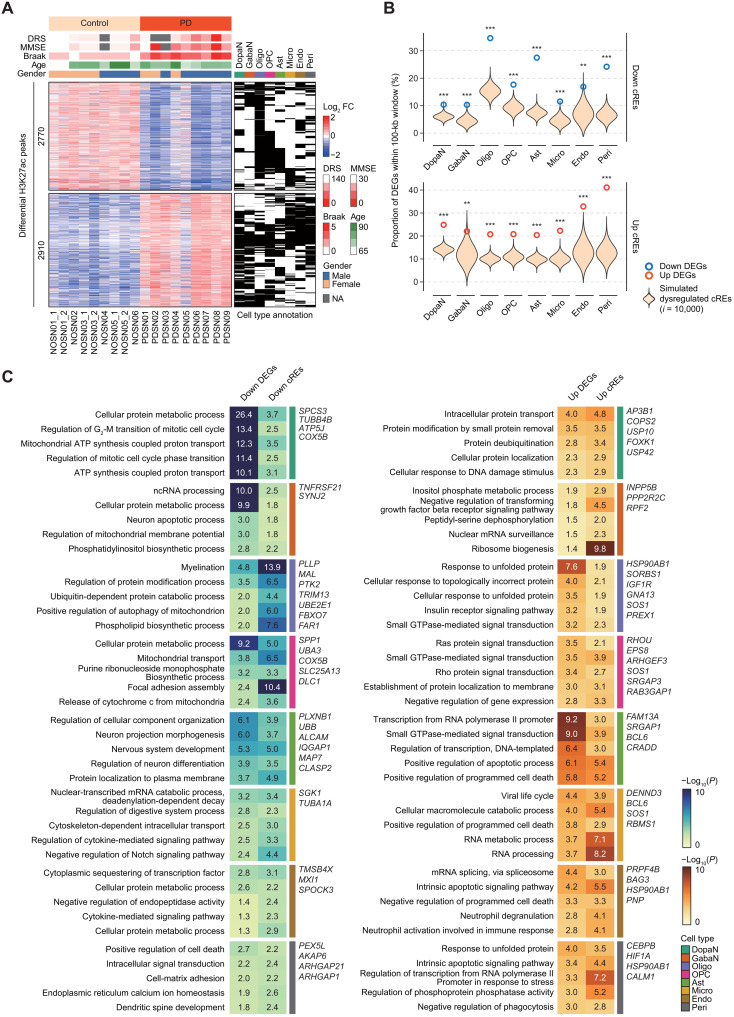
Fig. 2. Dysregulation of cREs shaping PD-specific gene expression.
(A) A heatmap of 2770 down-regulated and 2910 up-regulated cREs by log2 fold change of normalized H3K27ac ChIP-seq reads divided by the mean of all samples, along with binarized annotation of cell types. DRS, dementia rating scale; MMSE, mini mental state of examination; NA, not available. (B) Enrichment analysis for colocalization between DEGs and dysregulated cREs in a distance genomic window (100 kb). Violin plots represent the expected proportion of DEGs harbored by simulated cREs with 10,000 permutations. The observed proportion of DEGs is shown in bold donuts (blue for down-regulated DEGs and dark orange for up-regulated DEGs). The statistical significance was calculated based on empirical testing (**P < 0.01 and ***P < 0.001). (C) Top 5 enriched GO biological pathways for down-regulated (left) and up-regulated (right) DEGs commonly represented by genes annotated by dysregulated cREs through Genomic Regions Enrichment of Annotations Tool (GREAT) for individual cell types. DEGs within PD-related pathways that are also supported by dysregulated cREs are labeled. ATP, adenosine 5′-triphosphate.

