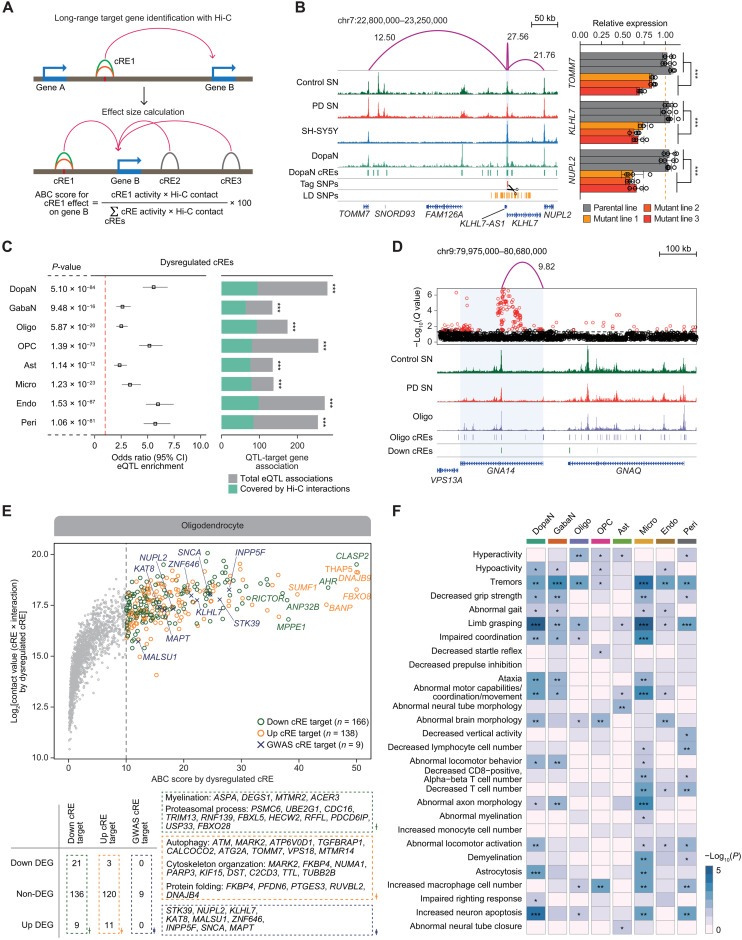
Fig. 3. Target gene inference for noncoding regulatory sequences through 3D chromatin contacts.
(A) The illustrative approaches to identifying long-range interaction target genes using high-resolution 3D chromatin contact map and to characterizing the cis-gene regulation circuitry by calculating the effect size of all cRE-to-gene promoter associations within 1 Mb based on ABC model. (B) Left: H3K27ac ChIP-seq tracks for control SN, PD SN, and SH-SY5Y neuroblastoma, along with pseudo-bulk chromatin accessibility for DopaNs. Additional tracks indicate the positions of DopaN cREs and PD GWAS-SNPs. Significant long-range chromatin interactions are shown in purple arcs with the corresponding ABC score. Right: Bar plots with dots indicating TOMM7, KLHL7, and NUPL2 RNA levels in the parental SH-SY5Y cells and three independent mutant clones. Each clone has three biological replicates (Welch two-sample t test, ***P < 0.001). (C) Forest plots showing the enrichment of eQTLs in dysregulated cREs (left) and the proportion of eQTL-target gene associations matched with Hi-C interactions (right). The P value and odd ratio were calculated using two-sided Fisher’s exact test for eQTL enrichment, and the significance of target gene overlap was calculated on the basis of hypergeometric test (***P < 0.001). CI, confidence interval. (D) An example of a down-regulated cRE in oligodendrocytes whose significant chromatin interactions to a target gene promoter is supported by eQTL associations, with H3K27ac ChIP-seq tracks for PD and control SN and pseudo-bulk chromatin accessibility for oligodendrocytes (Oligo). Significant long-range chromatin interactions are shown in purple arcs with the corresponding ABC score. (E) Top: A scatter plot illustrating the putative target genes for oligodendrocyte with an ABC score threshold of 10. Bottom: Putative target genes were categorized on the basis of DEG status and the representative GO biological pathways. (F) A heatmap illustrating the enrichment of 656 putative PD genes for 28 neurological, movement, and immune symptoms potentially associated with PD symptoms (*P < 0.05, **P < 0.01, and ***P < 0.001).

