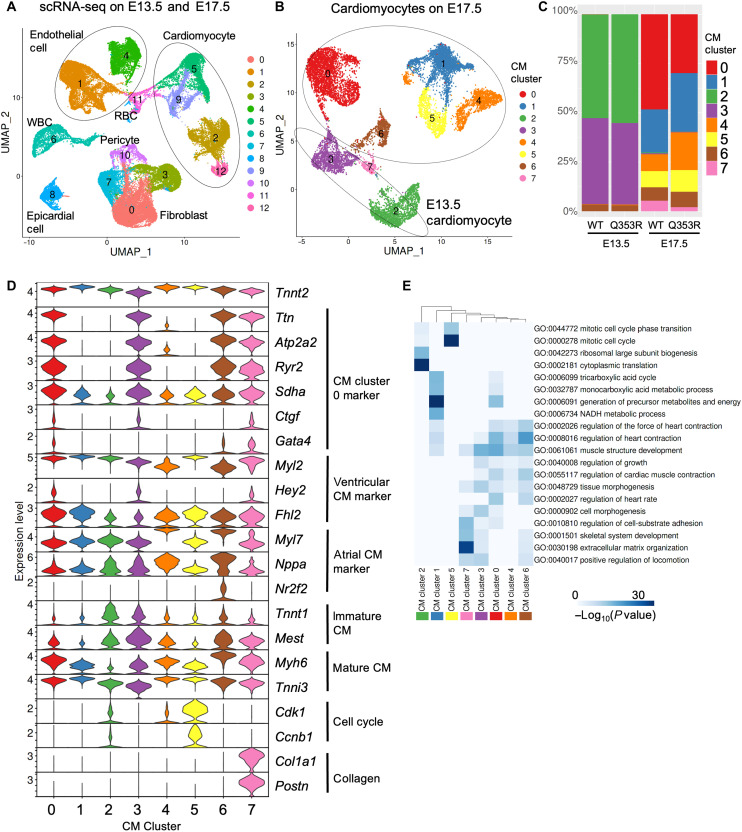
Fig. 2. Immature transcriptional dysregulation.
(A) The uniform manifold approximation and projection (UMAP) plot of scRNA-seq data of all cardiac cells derived from WT and LmnaQ353R/WT knock-in mice’s hearts at E13.5 and E17.5. All cardiac cells were classified into 13 cell clusters (clusters 0 to 12). WBC, white blood cell; RBC, red blood cell. (B) The UMAP plot of scRNA-seq data of cells annotated as CMs. CMs were classified into eight clusters (CM clusters 0 to 7). (C) Bar plot showing the distribution of CM clusters in each sample. WT, LmnaWT/WT; Q353R, LmnaQ353R/WT. (D) Violin plot showing gene expression levels of Tnnt2, representative marker genes of CM cluster 0, marker genes for ventricular, marker genes for atrial CM, genes associated with cell cycle, and genes associated with collagen grouped by CM clusters. (E) Heatmap showing the results of GO enrichment analysis for marker genes of each cluster.

