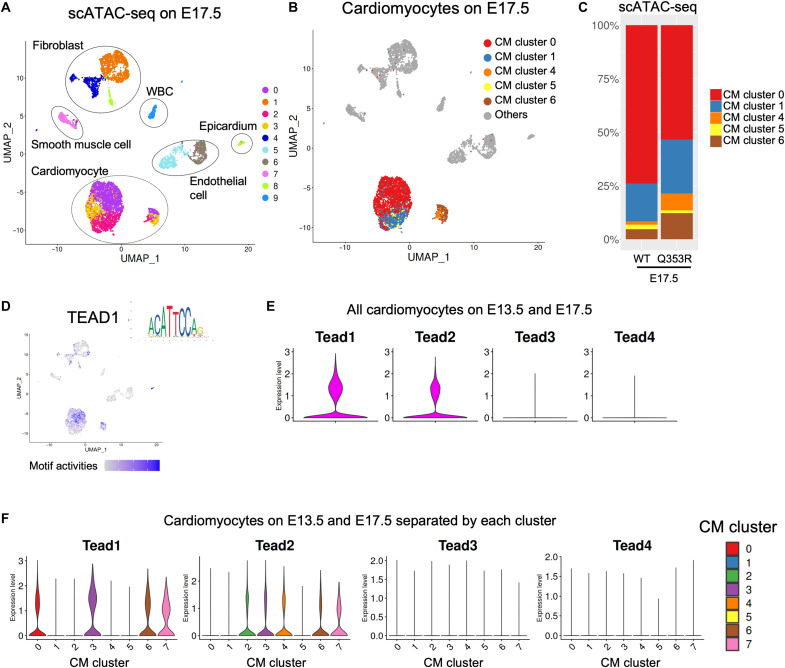
Fig. 3. TEAD1 regulates CM maturation.
(A) The UMAP plot of scATAC-seq data of all cardiac cells from WT and LmnaQ353R/WT knock-in mice at E17.5. All cardiac nuclei were classified into 10 clusters (clusters 0 to 9). (B) The UMAP plot pf scATAC-seq data colored by transferred CM subcluster labels of scRNA-seq data at E17.5 in Fig. 2B. (C) Bar plots showing the distribution of CM subclusters in WT and LmnaQ353R/WT knock-in mice at E17.5. (D) Motif activities of TEAD1 as visualized on the UMAP plot. (E) Violin plots showing the expression levels of TEAD family genes in all CMs. (F) Violin plots showing the expression levels of TEAD family genes in each CM cluster.

