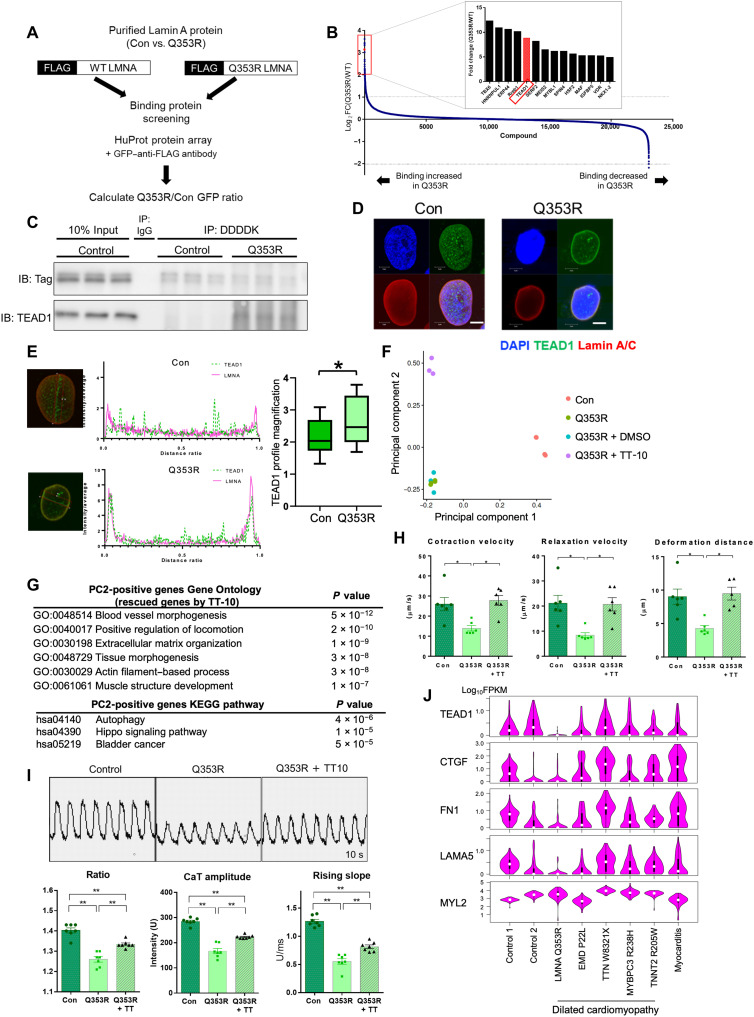
Fig. 6. TEAD1 trapping at the nuclear membrane.
(A) Scheme of the binding protein screening experiment. (B) Result of binding protein screening. Proteins are ordered according to the strength of interaction with mutant Q353R Lamin A/C. (C) Western blot of DDDDK-tag and TEAD1 using co-immunoprecipitated sample. Protein samples extracted from iPSCMs cells were pulled down using an anti-DDDDK tag antibody. Con, isogenic control iPSCMs; Q353R, LMNAQ353R/WT iPSCMs; IP, immunoprecipitation; IB, immunoblot. (D) Immunostaining of Lamin A/C and TEAD1 in Con and LMNA p.Q353R iPSCMs. Con, isogenic control iPSCMs; Q353R, LMNAQ353R/WT iPSCMs. Scale bars, 5 μm. (E) Quantification of TEAD1 intensity at the nuclear periphery of iPSCM. n = 14. *P < 0.05. M is the average value of the fluorescence intensity profile, and P is the fluorescence intensity profile on the nuclear membrane. By calculating and comparing the P/M value, significant differences between WT and Q353R were measured. WT: 2.13 ± 0.52; Q353R: 2.68 ± 0.48. (F) The principal components analysis (PCA) plot of bulk RNA-seq data of samples obtained from Con (n = 4), Q353R (n = 4), dimethyl sulfoxide (DMSO)–treated Q353R (n = 3), and TT-10–treated Q353R iPSCMs (n = 3). (G) GO term enrichment analysis of the top 200 genes sorted by principal component 2 (PC2) score, indicating rescued genes by TT-10 treatment. (H) Contractile properties of iPSCM microtissues (n = 6 per group). Q353R + TT-10, LMNAQ353R/WT iPSCMs treated with TT-10. *P <0.05; **P < 0.01. (I) (Top) Representative calcium transient images of iPSCMs, recorded for 10 s. (Bottom) Calcium transient analysis of the iPSCMs (n = 7 per group). *P <0.05; **P < 0.01. (J) Violin plot showing the expression level (log10FPKM) of representative TEAD1 target genes in single CMs from patients with DCM and myocarditis and control subjects. MYL2 is shown as a representative non-TEAD1 target gene.

