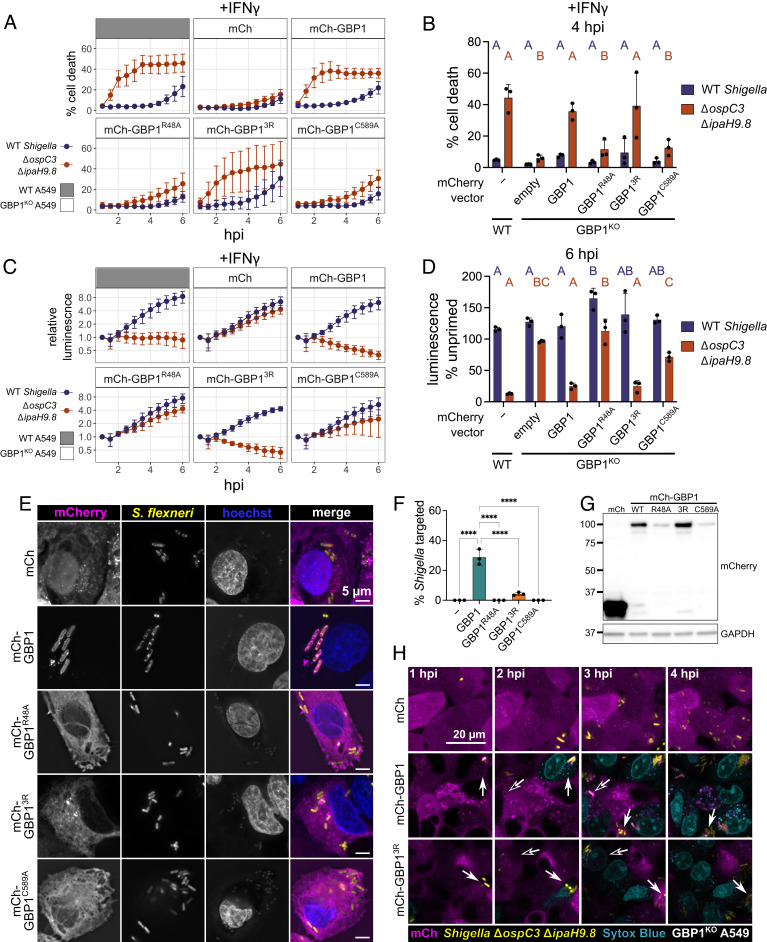
Fig. 5.
GBP1-dependent pyroptosis and restriction of S. flexneri growth is independent of GBP1 binding to bacteria. (A–D) Wild-type A549 or GBP1KO cells expressing mCherry or mCherry-GBP1 mutants were unprimed or primed with 100 U/mL IFNγ overnight, where indicated. Cells were infected with S. flexneri expressing a bioluminescent reporter and cell death was measured over time using sytox green fluorescence (A). The sytox green signal at 4 h was used to determine statistical significance (B). Bacterial luminescence was measured over time (C). Luminescence measurements from the 6 h timepoint were used to calculate the growth of each strain in primed cells relative to unprimed cells (D). (E and F) Wild-type A549 or GBP1KO cells expressing mCherry or mCherry-GBP1 mutants were primed overnight with IFNγ, then infected with GFP expressing S. flexneri ΔipaH9.8, and fixed at 2 h post infection. (E) Coverslips were imaged at 100× magnification using widefield microscopy. Images were deconvolved and z-projections are shown, scale bar are 5 μm. (F) Coverslips were imaged at 63× magnification, with images taken from five independent fields. Targeting of S. flexneri by each overexpressed protein was quantified using ImageJ. S. flexneri with indicated protein around at least 50% of the bacterial membrane were counted as targeted. (G) Expression levels of indicated overexpressed proteins determined by western blot. (H) Frames from timelapse microscopy at indicated time points for GBP1KO cells expressing mCherry, mCherry-GBP1, or mCherry-GBP13R infected with GFP expressing S. flexneri ΔospC3ΔipaH9.8. Dying cells are shown in blue (sytox blue). All graphs show averages from three independent experiments and are represented by mean ± SD. (B and D) Significance was determined using two-way ANOVA with Tukey’s multiple comparisons test. Statistical comparisons are shown by letters, with bars sharing no matching letters being significantly different. Purple letters correspond to statistical comparisons for wild-type S. flexneri, and orange letters correspond to S. flexneri ΔipaH9.8ΔospC3. (F) One-way ANOVA with Tukey’s multiple comparisons test was used. All significant comparisons are shown. *P < 0.05, **P < 0.01, ***P < 0.001, ****P < 0.0001.

