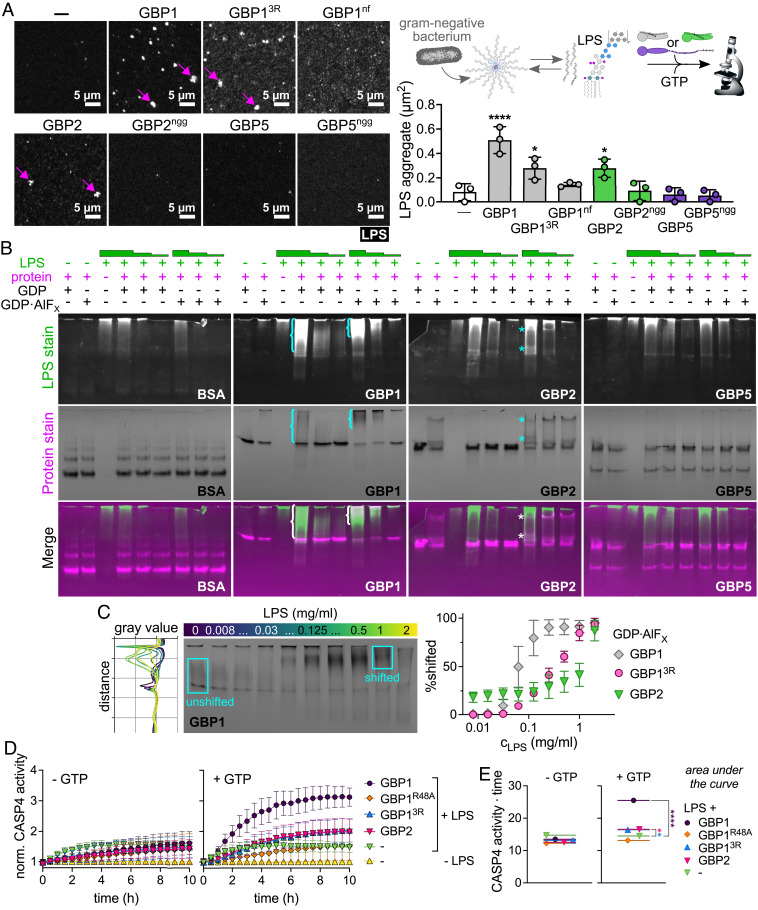
Fig. 7.
GBP1 and GBP2 bind and aggregate LPS and promote caspase-4 activation in vitro. (A) Recombinant isoprenylated and nonisoprenylated GBPs were supplemented with GTP and added to Alexa Fluor 568-labeled E. coli O55:B5 LPS. LPS particles were analyzed from different fields of view taken after 20 min with Fiji, and the average aggregate area was plotted. (B and C) Following mixing of recombinant proteins with E. coli O55:B5 LPS in the presence of different nucleotides, protein-LPS complexes were resolved with NPAGE, and gels were stained successively for LPS and proteins. (B) NPAGEs of BSA, GBP1, GBP2, and GBP5 supplemented with GDP or GDP·AlFX in the absence or presence of LPS (final concentrations 1 mg/mL, 0.1 mg/L, or 0.01 mg/mL). (C) NPAGE of GBP1 titrated with LPS (final concentrations 2 mg/mL to 0.008 mg/mL) supplemented with GDP·AlFX. Gray values for each gel lane were plotted with Fiji and areas were defined representing unshifted and shifted protein fractions. Percentage of shifted protein was plotted against LPS concentrations. (D and E) Following mixing of recombinant proteins with E. coli O55:B5 LPS in the absence or presence of GTP, protein-LPS complexes were added to recombinant caspase-4, and caspase-4 activity was determined by monitoring release of free 7-Amino-4-methylcoumarin (AMC) upon cleavage of fluorogenic caspase substrate Z-VAD-AMC over time. (D) Fluorescence intensities were normalized to basal caspase-4 activities. (E) The area under the curve was used to determine statistical significance. Caspase-4 – CASP4. All graphs show averages from three independent experiments and are represented by mean ± SD. (A and E) One-way ANOVA with Dunnett’s multiple comparisons test comparing to control (no GBP addition) was used. All significant comparisons are shown. *P < 0.05, ****P < 0.0001. (B and C) Representative NPAGEs from two (B) or three (C) independent experiments are shown.

