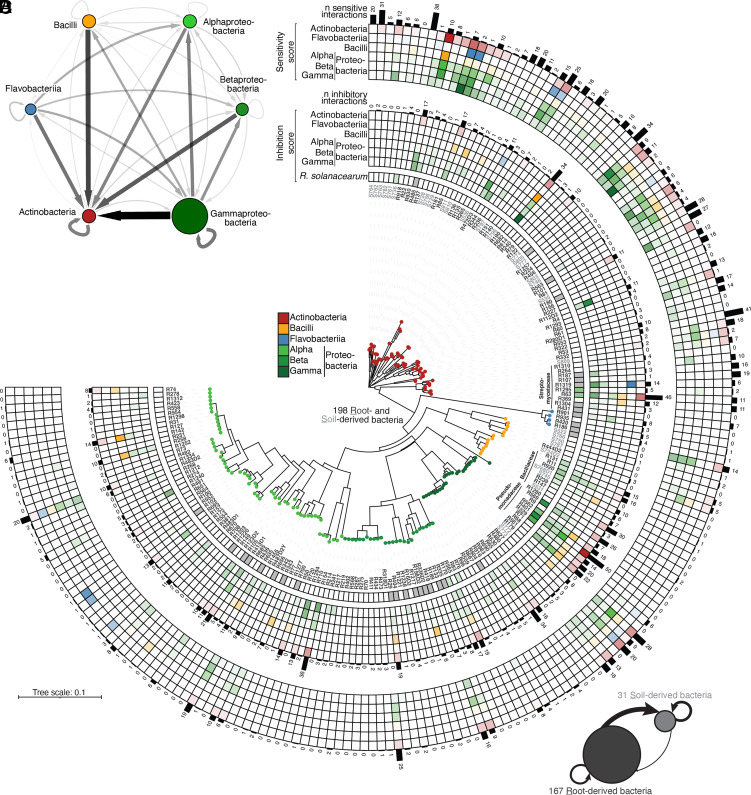
Fig. 1.
Widespread production of specialized exometabolites among root- and soil-derived bacteria. (A) Inhibitory interaction network based on binary interaction data from a modified Burkholder assay (mBA; n = 198 strains, 39,204 pairwise combinations tested, 1 to 2 biological replicates). Edge width and color depict the aggregated frequency of inhibitions at the class level while node size indicates the mean halo size, measured at 4 d post-inoculation (dpi). Arrows reflect inhibition directionality and intensity. For the complete list of interactions, see SI Appendix, Table S1. (B and C) Phylogenetic tree showing inhibition and sensitivity scores for each strain. The tree was built based on the full-length 16S rRNA gene sequences of 167 root- (dark gray) and 31 soil-derived (light gray) bacteria. All bacteria were reciprocally screened against each other and against Ralstonia solanacearum GMI1000. For each strain, sensitivity scores (average sensitivity of a strain to exometabolites produced by a given bacterial class) (B) and inhibition scores (average exometabolite-dependent inhibition of a given strain to a bacterial class) (C) are shown in the outer and inner heatmaps, respectively. These scores represent the average halo size for a given strain at the class level and were determined by an mBA. The number (“n”) of sensitivities per strain and the number of inhibitory interactions are indicated by black bars. (D) Network showing the aggregated frequency of inhibitions measured for root- and soil-derived bacteria. Node size indicates the mean magnitude of inhibitions from mBA experiments. Arrows reflect inhibition directionality and intensity.

