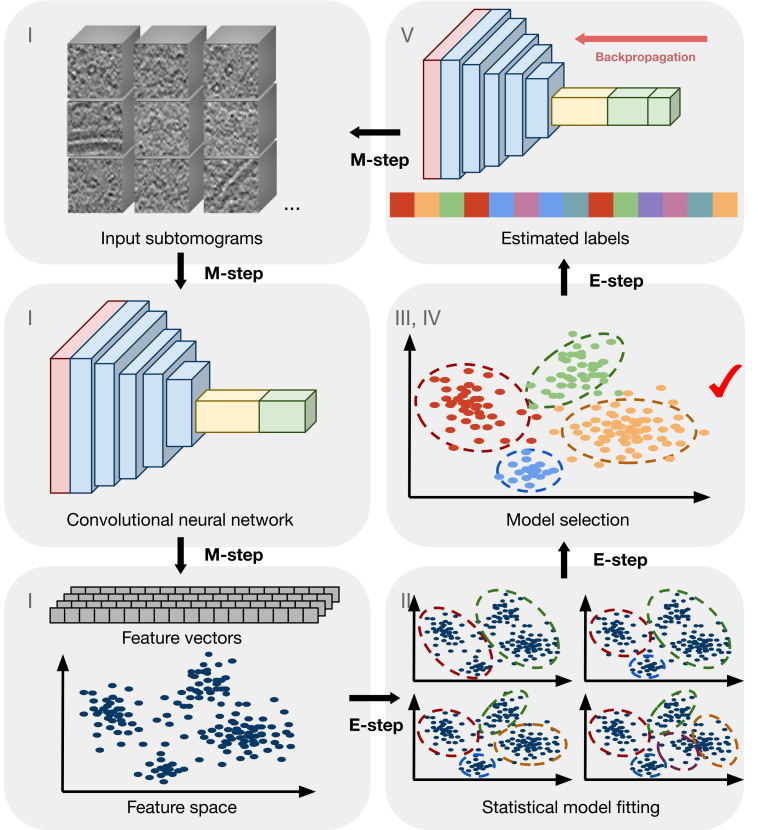
Fig. 2.
Conceptual explanation of DISCA. The numbers correspond to key steps in SI Appendix, Fig. S1. The input is a set of subtomograms extracted from tomograms using template-free picking methods. CNN features extracted (step I) from subtomograms are statistically modeled (step II) to estimate the cluster labels (steps II and IV). The CNN is in turn trained (step V) using the current estimated labels in order to learn better features iteratively.

