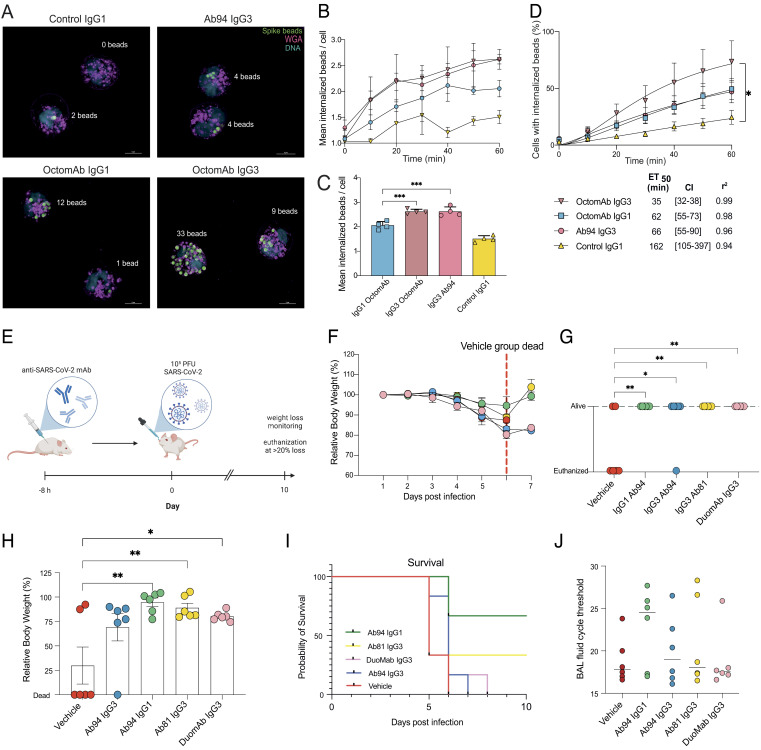
Fig. 4.
Fc-mediated protection in vivo with hACE2-K18 mice and live imaging of human neutrophil phagocytosis. (A) Super-resolution structured illumination microscopy images showing human neutrophil phagocytosis of spike beads opsonized with indicated treatments. Beads are seen in green color in the picture (far red stain), cell surface in magenta (Alexa 594-WGA), and DNA in blue (Hoechst). pHrodo green was used as an internalization marker not seen in the image. Different antibody treatments result in differences in the number of beads internalized and the percentage of cells internalizing beads. SIM images are seen in a maximum-intensity projection of Z-stacks. Example images are shown from one experiment out of four. (Scale bars are 5 µm.) (B) Change in the average number of beads for the neutrophils with internalized beads over time. The bar graph in (C) shows the results after 60 min. (D) Temporal change in phagocytosis is monitored and displayed in terms of neutrophils with internalized spike beads. Below the graphs, ET50 values are presented in the table with 95% CIs in brackets. (E) Human ACE2-K18 mice were prophylactically injected intraperitoneally with antibody treatment or vehicle. Eight hours posttreatment, mice were infected intranasally with SARS-CoV-2 (Wuhan strain). Body weights were measured over 10 d. (F) Mean relative body weight for each group from days 0 to 7, the red dashed line highlights when all mice in the control group were deceased. (G) Status of each mouse (alive/killed) in each treatment group at day 6. (H) Relative body weight for each mouse in each treatment group at day 6, with killed mice set to 0. (I) Survival curves for each treatment group over the 10-d experiment. (J) Terminal titers of viral load were analyzed from BAL-fluid from mice that were killed, irrespective of which day of death. qPCR was done on BAL-fluid, and the cycle threshold was recorded and graphed. The median value is shown. The mean value is shown for figures B–D and F–J, with error bars being SEM. Statistical analysis was performed by one-way ANOVA, and correction for multiple comparisons was done with Tukey’s test. * denotes P value below 0.05, ** denotes below 0.01, *** denotes below 0.001, **** denotes below 0.0001, and ns denotes P values above 0.05 and are not shown. In B–D, the data are from four independent experiments with four different donors.

