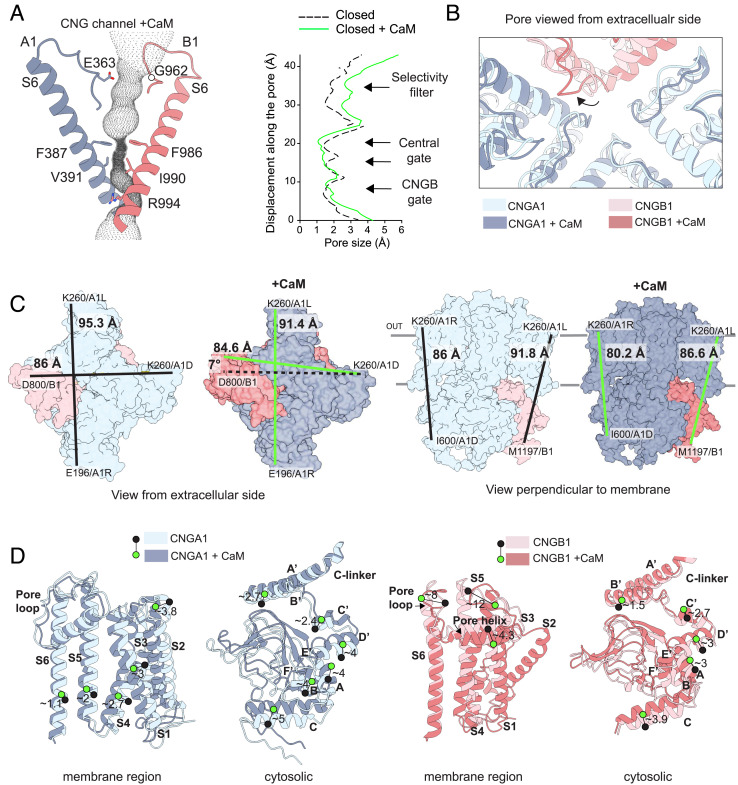
Fig. 4.
Comparison of the rod CNG channel structures without and with CaM. (A) Details of the pore tunnel formed by CNGA1 (blue) and CNGB1 (pink) with the calculated cavity volume in dotted gray. Right, pore radius along the central pore axis in the closed state calculated with HOLE (57) without CaM (dashed, black) (PDB: 7O4H) and with CaM (continuous, green). (B) View from the extracellular side down into the pore of the two superimposed structures showing the pore loops and the ion-conduction pathway. The shift in position of the CNGB1 pore loop is indicated with a black arrow. (C) Left, view from the extracellular side without and with CaM represented as colored surface. Distances between residues are indicated with lines in black (no CaM), or green (with CaM). Right, side view from the axis perpendicular to the membrane. (D) Left, details of the displacement between pairs of residues in transmembrane segments or the cytosolic region for CNGA1 (chain C) without (light blue) and with CaM (dark blue); Right, same analysis for the CNGB1 subunit. Green and black circles indicate the position of C-alpha atoms for the same amino acid in the two structures. Distances are indicated in Angstroms (Å).

