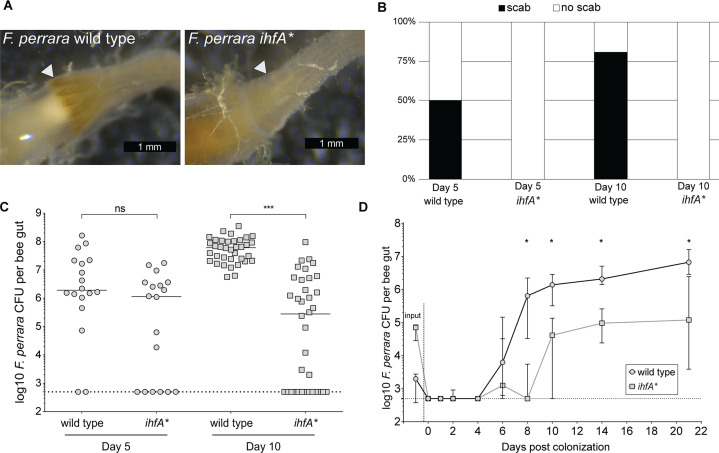
Figure 3. F. perrara ihfA* mutant displays a colonization defect.
(A) Light microscopy pictures of pylorus region of bees colonized with F. perrara PEB0191wt or ihfA* 10 d post colonization. (B) Quantification of scab phenotype of bees 5 and 10 d post colonization with n = 18 and n = 36 per treatment, respectively. (C) Quantification of colonization levels is measured by colony-forming units (CFUs) at day 5 (n = 18) and day 10 (n = 36) post colonization. Wilcoxon rank-sum test was used to assess significant differences. (D) Time-course experiment of bees colonized with F. perrara wt or ihfA*. Colonization levels were measured by CFUs every second day until day 10 and then at day 14 and day 21. n = 12 bees per time point per treatment. Wilcoxon rank-sum test was used to assess significant differences per time point. Error bars represent median and interquartile range. Data from three independent experiments. *p<0.05, **p<0.01, ***p<0.001. Figure 3—source data 1 contains the numeric values for the figures shown here.


