
Figure 6. Gut colonization phenotypes of different gene-deletion mutants of F. perrara.
(A) Colonization levels were assessed 10 d after inoculation by counting colony-forming units (CFUs) in dilutions of homogenized bee guts plated on Brain Heart Infusion (BHI) agar. Only the pylorus and ileum section of the gut were analyzed. Limit of detection (LOD) corresponds to the lowest colonization level detectable in our assay, that is, points below the LOD correspond to bees for which no CFUs were detected. Statistically significant differences of the colonization levels of each mutant relative to the wt of F. perrara were determined using the Wilcoxon rank-sum test with BH correction. Bees were inoculated with an OD600 of 0.1. Data come from two independent experiments. Figure 6—figure supplement 5 shows the data points by experiments. *p<0.05, **p<0.01, ***p<0.001. Filled circle colors indicate whether a scab was detected during dissection (green = scab; yellow = no scab). (B) Location within the pylorus was assessed using FISH microscopy. Bees were inoculated with different F. perrara genotypes at OD600 = 0.1, guts were dissected at day 10 after inoculation and sectioned using a microtome. Hybridizations were done with probes specific for F. perrara (magenta). DAPI counterstaining of host nuclei and bacteria is shown in blue. Images were generated by merging brightfield, F. perrara and DAPI images that were obtained for the same section of the gut. The composite images here shown were obtained by merging the images of each channel presented in Figure 6—figure supplements 6 and 7. These were obtained using the ×5 and ×40 objectives of the Zeiss LSM900. Scale bar for images obtained with ×5: 100 µm, for ×40: 20 µm. Figure 6—source data 1 contains the numeric values used to generate (A).

Figure 6—figure supplement 1. Scheme of the gene-deletion strategy based on a two-step homologous recombination procedure.

Figure 6—figure supplement 2. Growth curves for the different Frischella strains.

Figure 6—figure supplement 3. Single-cell imaging of F. perrara strains.

Figure 6—figure supplement 4. Correspondence between OD and colony-forming unit (CFU) for F. perrara genotypes.
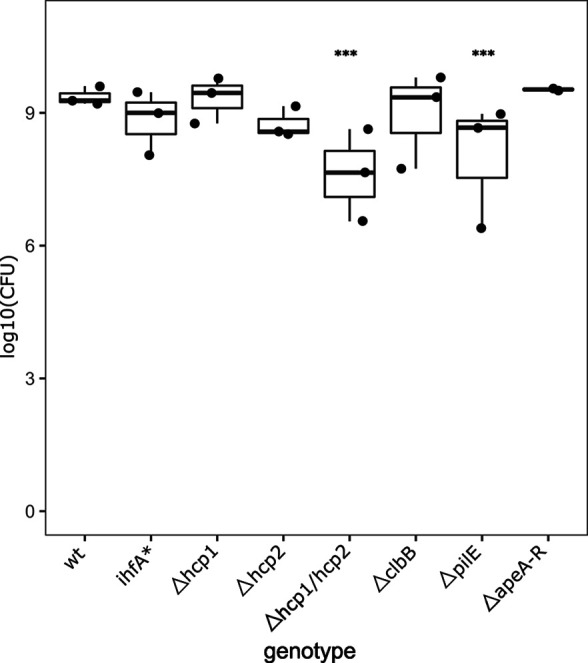
Figure 6—figure supplement 5. Same graph as shown in Figure 6 but data points are labeled by experiment.
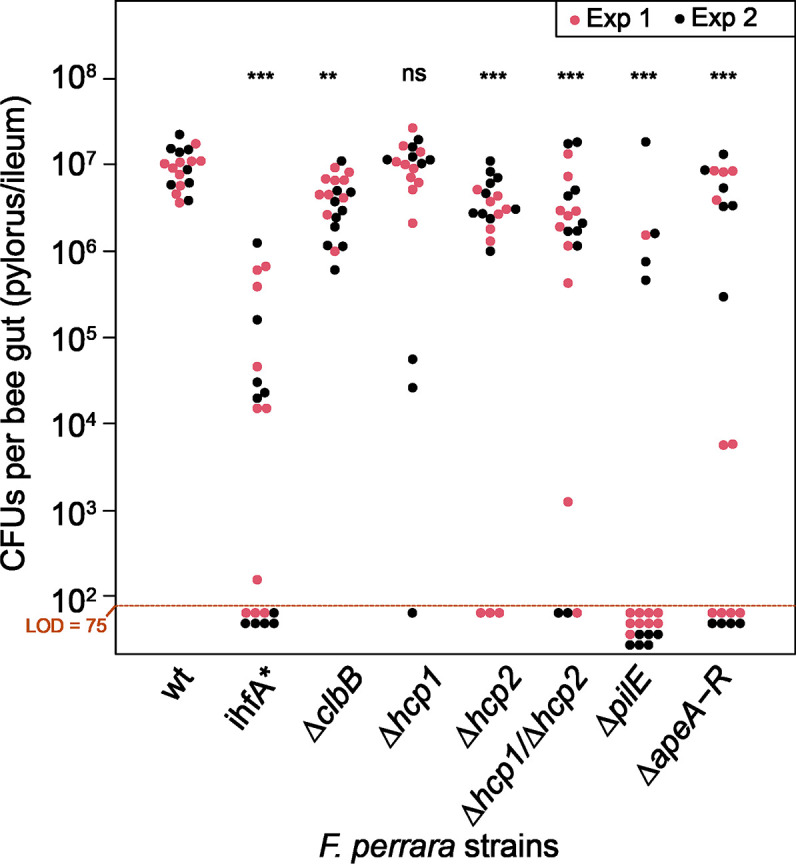
Figure 6—figure supplement 6. F. perrara colonization of the pylorus.

Figure 6—figure supplement 7. F. perrara colonization of the pylorus.
