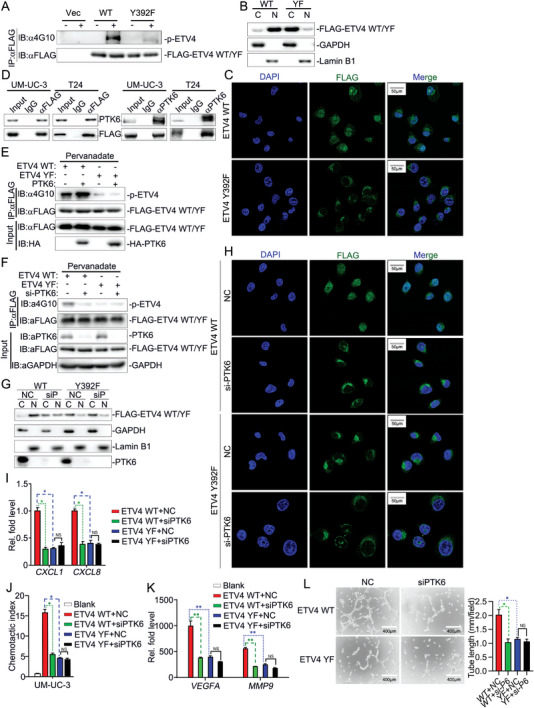
Figure 6.

Phosphorylation of ETV4 at Y392 by PTK6 regulates the nuclear translocation of ETV4. A) Immunoprecipitation (with anti‐FLAG) and immunoblot analysis (with anti‐4G10 or anti‐FLAG) of the empty vector (CON.) and ETV4 WT or Y392F overexpression vector stably transfected UM‐UC‐3 cells in the absence or presence of pervanadate for 30 min. B) Immunoblot analysis of cytoplasmic (C) and nuclear (N) FLAG‐ETV4, GAPDH and Lamin B1 in ETV4 WT or Y392F overexpression vector stably transfected UM‐UC‐3 cells. C) Representative immunofluorescence images staining for FLAG‐ETV4 in ETV4 WT or Y392F overexpression vector stably transfected UM‐UC‐3 cells. D) Immunoprecipitation (with anti‐FLAG, anti‐PTK6 or control IgG) and immunoblot analysis (with anti‐FLAG or anti‐PTK6) of the empty vector (CON.) and ETV4 WT or Y392F overexpression vector stably transfected UM‐UC‐3 cells. E) Immunoprecipitation (with anti‐FLAG) and immunoblot analysis (with anti‐4G10, anti‐HA or anti‐FLAG) of HEK293 cells transfected with plasmids encoding HA‐PTK6 and FLAG‐ETV4 in the absence or presence of pervanadate for 30 min. F) Immunoprecipitation (with anti‐FLAG) and immunoblot analysis (with anti‐4G10, anti‐HA or anti‐FLAG) of UM‐UC‐3 cells that stably express FLAG‐ETV4 WT or Y392F, treated with NC or siPTK6 for 48 h. G) Immunoblot analysis of cytoplasmic (C) and nuclear (N) FLAG‐ETV4, PTK6, GAPDH and Lamin B1 in UM‐UC‐3 cells that stably express FLAG‐ETV4 WT or Y392F, treated with NC or siPTK6 for 48 h. H) Representative immunofluorescence images staining for FLAG‐ETV4 in UM‐UC‐3 cells that stably express FLAG‐ETV4 WT or Y392F, treated with NC or siPTK6 for 48 h. I) qRT‐PCR analysis of CXCL1 and CXCL8 mRNA in ETV4 WT or Y392F overexpression vector stably transfected UM‐UC‐3 cells, which were treated with NC or siPTK6 for 48 h. J) Chemotactic index analysis of neutrophils attracted by indicated UM‐UC‐3 CM. K) qRT‐PCR analysis of VEGFA and MMP9 mRNA in neutrophils incubated with indicated UM‐UC‐3 CM. L) Representative images of tube formation assay of HLECs incubated with CM from neutrophils with the indicated treatment for 6 h, histograms show means and SD for tube length. Statistical significance was assessed using two‐tailed t tests or one‐way ANOVA. NS p >0.05, *p <0.05, **p < 0.01. Data are representative of two (A–G, J,L) or three independent experiments (mean ± S.D. in I,K).
