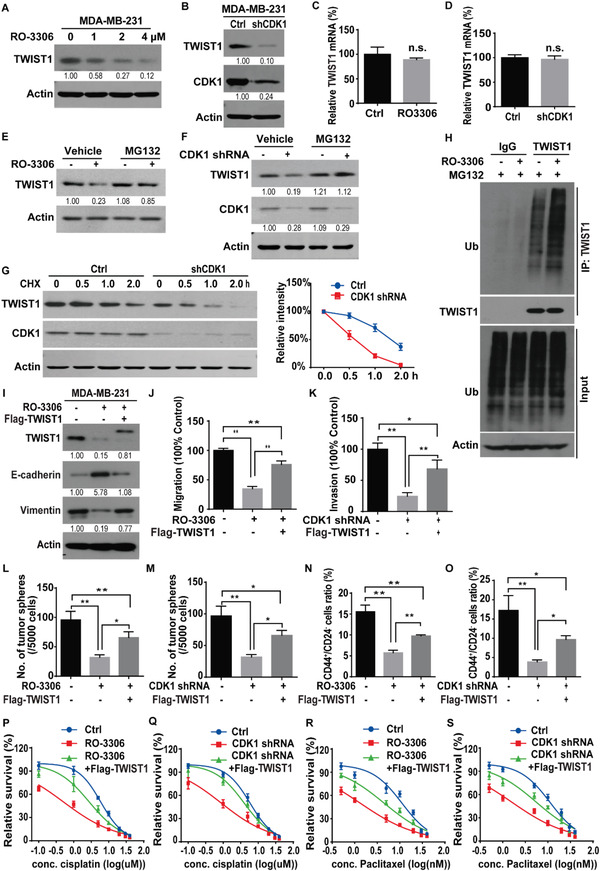
Figure 5.

CDK1 regulates TWIST1 protein stability, CSC self‐renewal, and cellular sensitivity to chemotherapy. A) MDA‐MB‐231 cells were treated with indicated concentrations of RO‐3306 for 24 h and western blot was performed with indicated antibodies. B) Cells stably expressing control (Ctrl) or CDK1 shRNA were generated and western blot was performed with indicated antibodies. C,D) Total RNA was isolated from cells in (A) or (B). The expression of TWIST1 mRNA in cells was determined by quantitative PCR. Transcript levels were determined relative to GAPDH mRNA level and normalized relative to control. The results represent mean ± s.d. from three independent experiments. E) Cells were pretreated with vehicle or RO‐3306 for 24 h. Then, cells were treated with either vehicle or MG‐132 (10 µm) for an additional 6 h. TWIST1 level was detected by western blotting. F) Cells stably expressing control or CDK1 shRNA were treated with vehicle or MG132 and western blot was performed with indicated antibodies. G) Cycloheximide pulse‐chase assay was performed in cells as in (B) and results are quantified in right panel. The results represent mean ± s.d. from three independent experiments. H) Cells were treated with vehicle or RO‐3306 for 24 h in the presence of MG‐132 (10 µm) and cell lysates were subjected to immunoprecipitation with IgG or anti‐TWIST1. The polyubiquitylated TWIST1 protein was detected by anti‐ubiquitin antibody. I) MDA‐MB‐231 cells were transfected with indicated plasmids and treated with vehicle, or RO‐3306. Western blot was performed with indicated antibodies. J) Graphic representation of the migration ability from cells described in (I) was examined by Transwell migration assay. The results represent mean ± s.d. from three independent experiments; **p < 0.01. K) MDA‐MB‐231 cells stably expressing control or CDK1 shRNA were transfected with indicated plasmids. The invasiveness of cells was analyzed by Transwell invasion assay. The results represent mean ± s.d. from three independent experiments; **p < 0.01. L,M) Graphic representation of mammosphere formation assay from cells described in (I) or (K). The results represent mean ± s.d. from three independent experiments; *p < 0.05, **p < 0.01. N,O) Graphic representation of the CD44+/CD24− population from cells described in (I) or (K) was examined by FACS analysis. The results represent mean ± s.d. from three independent experiments; *p < 0.05, **p < 0.01. Cells as in (I) or (K) were treated with P,Q) cisplatin or R,S) paclitaxel and cell survival was determined. The results represent mean ± s.d. from three independent experiments.
