Figure 5.

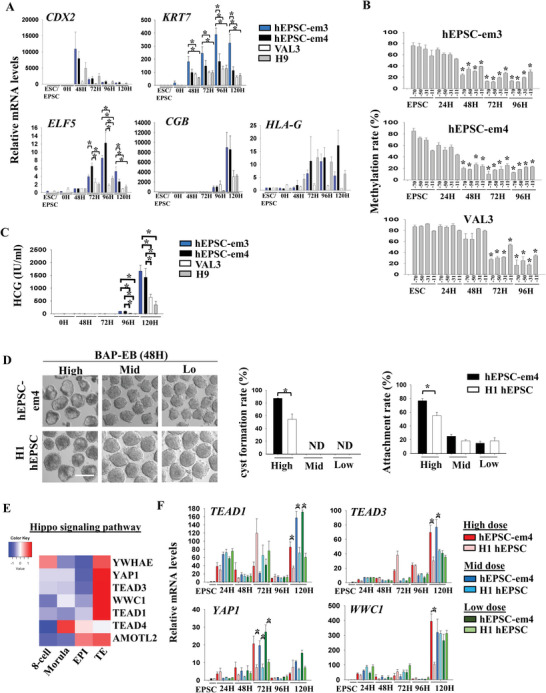
hEPSC‐em are susceptible to induction of trophoblast differentiation. A) RT‐qPCR analysis of CDX2, KRT7, ELF5, HCG, and HLA‐G gene expressions in BAP‐EB differentiated from hEPSC‐em‐3 (blue bars), hEPSC‐em‐4 (black bars), and primed hESC (VAL3 [white bars] and H9 [grey bars]). *p < 0.05 comparing between experimental groups; t‐test; n = 3. B) DNA methylation rates (%) of CpG sites at ELF5 promoter during BAP‐EB differentiation in different cell lines. *p < 0.05 compared to EPSC control; t‐test; n = 3. C) HCG level (IU mL−1) in spent media collected during BAP‐EB differentiation from different cell lines. *p < 0.05 comparing EPSC control; t‐test; n = 3. D) Left: Photos showing trophoblast spheroids (BAP‐EB) differentiated from hEPSC‐em‐4 and hEPSC‐ES at 48 h under different doses of BAP. Scale bar: 100 µm. Right: proportion of cystic BAP‐EB formation and the endometrial Ishikawa cell line attachment rates between hEPSC‐em‐4 (black bars) and hEPSC‐ES (white bars) under different doses of BAP treatments. *p < 0.05 comparing between experimental groups; t‐test; n = 3. ND: not detected. E) Heatmap showing the expression levels of genes under the category of Hippo signaling pathway in human pre‐implantation embryos. scRNA‐seq data of human pre‐implantation embryos was from ref. [12]. F) RT‐qPCR analysis of TEAD1, TEAD3, YAP1, and WWC1 gene expression during trophoblast differentiation from hEPSC‐em‐4 and hEPSC‐ES at different time points under high, mid, and low doses of BAP. *p < 0.05 comparing between experimental groups; t‐test; n = 3.
