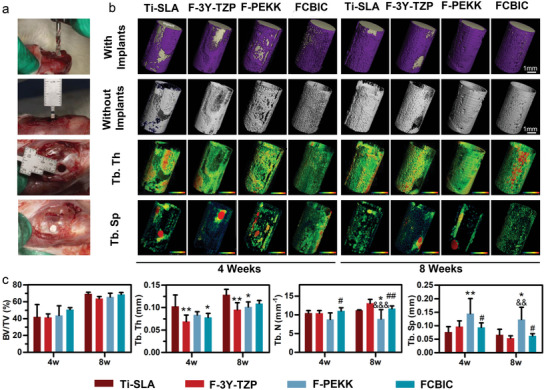
Figure 5.

µCT evaluation of osseointegration on implants 4 and 8 weeks post‐operation. a) Digital images of the implant surgery. b) 3D reconstructed µCT images of newly regenerated bone around the implants. c) Quantitative analysis of µCT data (n = 4). *p < 0.05, **p < 0.01 versus sandblasted, large‐grit, acid‐etched Ti (Ti‐SLA); && p < 0.01, &&& p < 0.001 versus F‐3Y‐TZP; # p < 0.05, ## p < 0.01 versus F‐PEKK.
