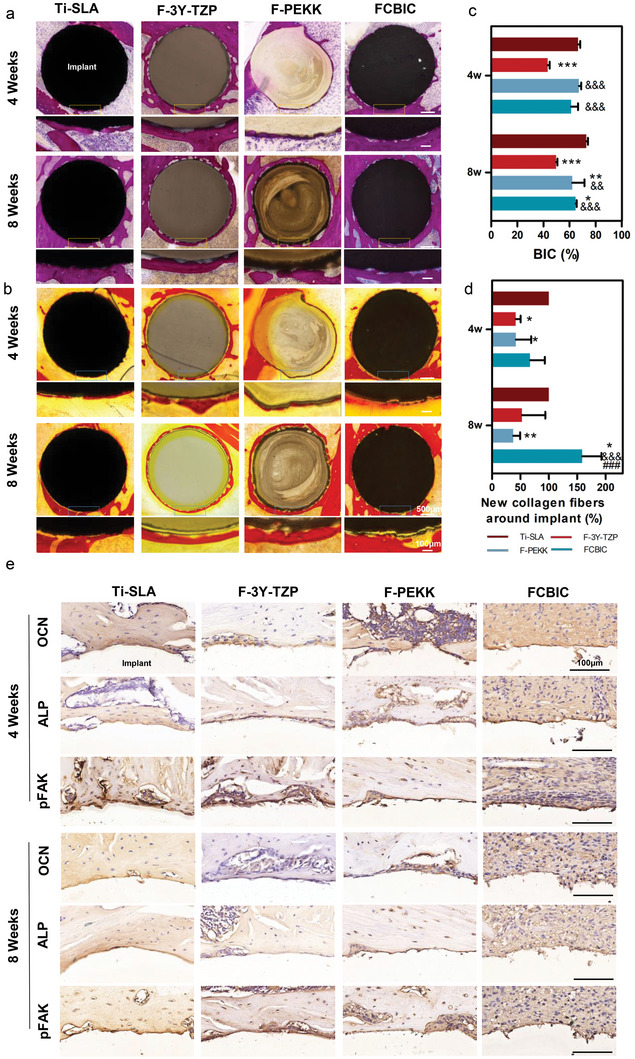
Figure 6.

Histomorphometric and immunohistochemical analysis of the osteogenesis of the peri‐implants at 4‐ and 8‐weeks post‐operation. a) Methylene blue‐acid magenta staining and c) bone‐to‐implant contact (BIC) ratios. b) Van Gieson's picrofuchsin and d) semi‐quantitative analysis of the newly formed collagen fibers around the implant (n = 3). e) Immunohistochemical staining of osteocalcin (OCN), alkaline phosphatase (ALP), and phosphorylated FAK (pFAK) around implants. *p < 0.05, **p < 0.01, ***p < 0.001 versus sandblasted, large‐grit, acid‐etched Ti (Ti‐SLA); && p < 0.01, &&& p < 0.001 versus F‐3Y‐TZP; ### p < 0.001 versus F‐PEKK.
