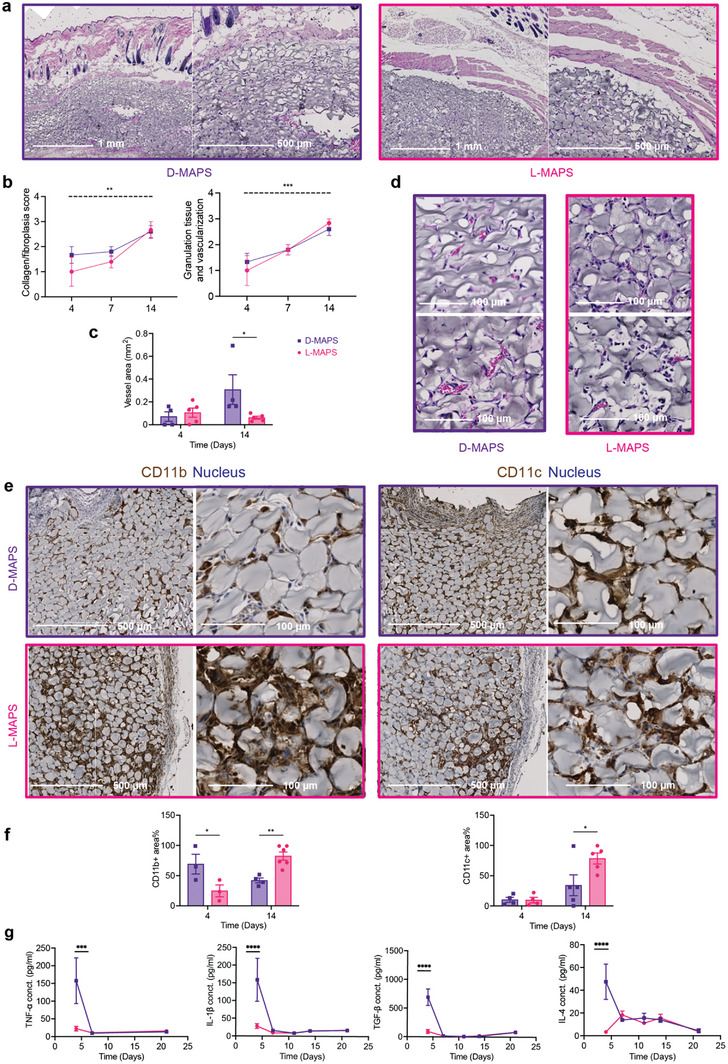
Figure 1.

D‐MAPS elicited an early immune response on day 4 and yielded a better implant integration outcome. a) Representative pictures of Hematoxylin and eosin (H&E) staining on day 14. Each row from left to right showed pictures with objectives of 5x. b) Histologic assessment of tissue integration level in L‐ and D‐MAPS based on a modified 4‐point scoring system established and agreed upon by two dermatopathologists. The dotted line indicated a significant time‐dependent difference in both scaffolds. c) Representative pictures of H&E staining at the center of implant with 20x objective. Scale bar, 100 µm. d) Histologic assessment of angiogenesis in terms of blood vessel area per implant in L‐ and D‐MAPS, measured in ImageJ. e) Representative pictures of Immunohistochemical staining of CD11b and CD11c on day 14 at objectives 5x (skin/dorsal interface, scale bar, 500 µm), and 20x (capsule/ventral interface, scale bar, 100 µm). f) Quantification of the percentage of CD11b+ and CD11c+ area among all the cell areas. g) ELISA results of selected cytokine concentrations inside the hydrogel implants. Statistical analysis: two‐way ANOVA with Šídák's multiple comparisons test made between L‐ and D‐MAPS groups only when there was a significance in the interaction term of scaffold type x time. ∗ p < 0.05, ∗∗ p < 0.001, ∗∗∗ p < 0.001, ∗∗∗∗ p < 0.0001. Error bars, mean ± s.e.m. n = 6 mice per group for (a–f) and n = 5 for g with some data points removed due to experimental reasons. Experiments were repeated at least 2 times.
