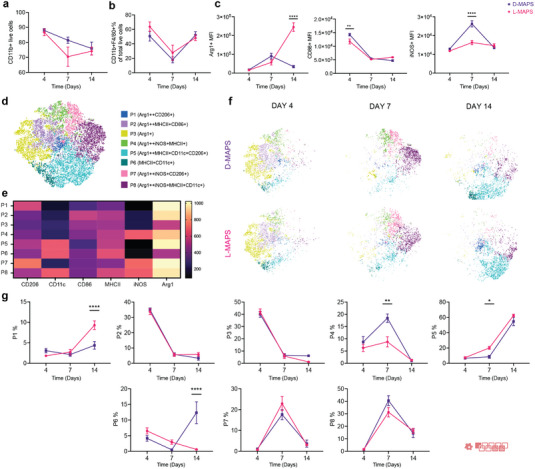
Figure 3.

A balanced M1/M2 macrophage phenotype induced in pro‐regenerative D‐MAPS. a) The percentage of CD11b+ cells in total live cells across 3 time points. b) F4/80+ macrophage percentage in CD11b+ live cells. c) MFI of Arg1, CD86, and iNOS in total macrophage population (CD11b+F4/80+) over time. d) tSNE clustering of the CD11b+ F4/80+ live cells and FlowSOM of 8 subpopulations at days 4, 7, and 14 post‐implantations. e) FlowSOM Heatmap of six phenotypical markers (Arg 1, CD206, CD11c, iNOS, CD86, MHCII) f) tSNE clustering of the CD11b+ F4/80+ live cells at days 4, 7, and 14 post‐implantations. g) Percentage each sub‐population from the total macrophage population at the specific time point. Statistical analysis: two‐way ANOVA with Šídák's multiple comparisons test made between L‐ and D‐MAPS groups only when there was a significance in the interaction term of scaffold type x time. ∗ p < 0.05, ∗∗ p < 0.001, ∗∗∗ p < 0.001. Error bars, mean ± s.e.m. n = 6 mice per group. The red symbol in the bottom right corner of the graph stands for the 9‐color macrophage panel used in this figure.
