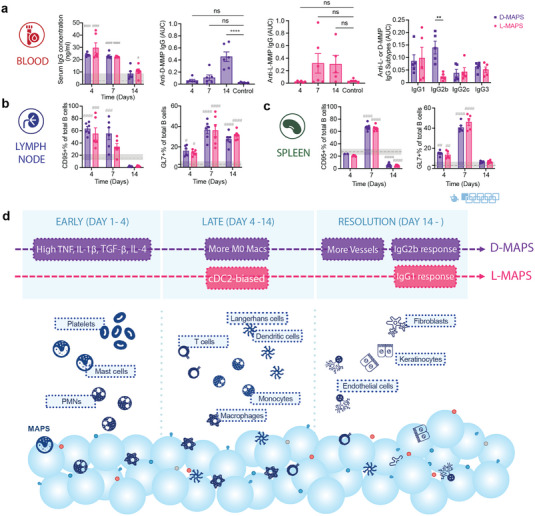
Figure 6.

A robust linker‐specific IgG response to D‐MAPS was detected as early as 14 days post‐implantation. a) ELISA results of total serum IgG concentration in the blood for mice with L‐ or D‐MAPS implants, anti‐D‐MMP IgG level in mice with D‐MAPS implants, anti‐L‐MMP IgG level in mice with L‐MAPS implants and anti‐L‐ or D‐MMP IgG subtypes on day 14. b) CD95+% in total B cell population in draining lymph nodes (dLN) and spleen of mice with D or L‐MAPS implants across 3 time points. c) GL7+% in total B cell population in draining lymph nodes (dLN) and spleen of mice with D or L‐MAPS implants across 3 time points. d) Schematic illustration of the innate and adaptive immune response to D‐ and L‐MAPS during subcutaneous implantation. The blue spheres represent MAPS, with peptides (colored circles and handles) on the surface. Statistical analysis: two‐way ANOVA with Šídák's multiple comparisons test made between L‐ and D‐MAPS groups only when there was a significance in the interaction term of scaffold type x time. After a two‐way ANOVA, Dunnet method was used to compare the experimental groups with the baseline control group. * p<0.05, **/## p<0.01, ***/### <0.001, ****/#### <0.0001. Asterisks stand for comparisons between L‐ and D‐MAPS. Pound signs stand for comparisons between L‐ or D‐MAPS and the baseline control (mice without implant). Error bars, mean ± s.e.m. n = 6 mice per group. The blue symbol beneath panel (c) stands for the 9‐color B panel used in panels (b, c) of this figure.
