
Figure 3.
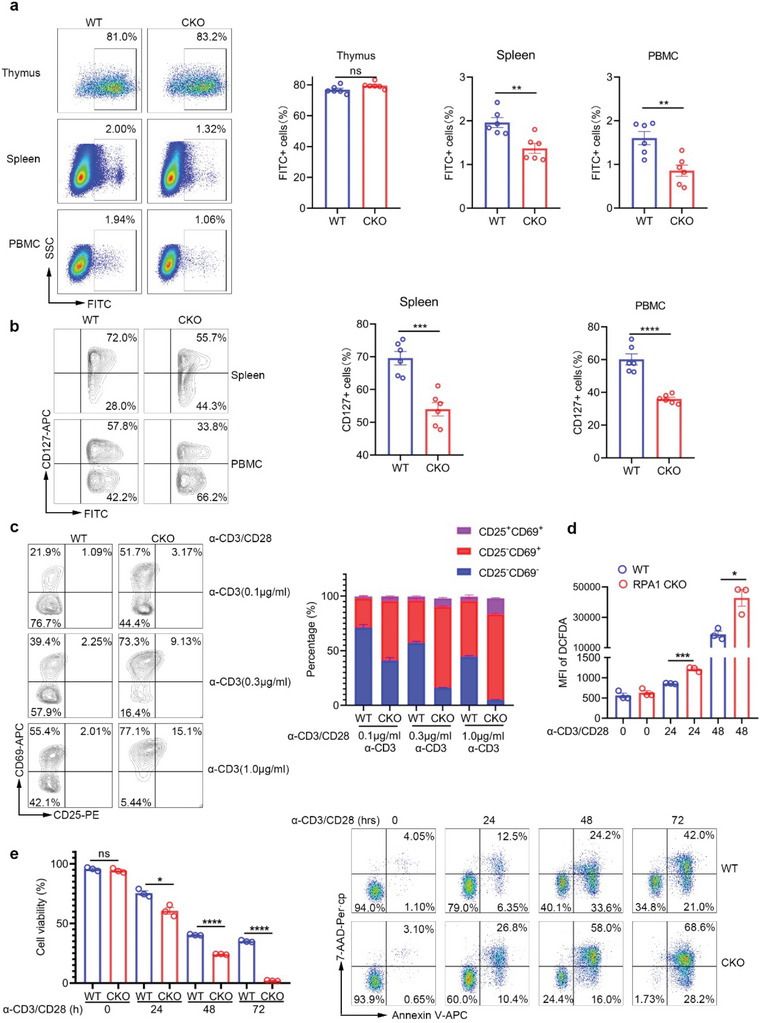
Loss of RPA1 promotes T cell death upon antigenic stimulation. a) Flow cytometric analysis of the frequencies of FITC+ cells in thymus, spleen and peripheral blood mononuclear cell (PBMC) from 6‐week‐old male WT and CKO mice 24 h after intrathymic injection of FITC (n = 6 mice, mean ± s.e.m., ns, not significant (P > 0.05), **P < 0.01, two‐tailed unpaired Student's t‐test). b) Flow cytometric analysis of the frequencies of CD127+ cells in FITC+ cells from 6‐week‐old male WT and CKO mice 24 h after intrathymic injection of FITC (n = 6 mice, mean ± s.e.m., ***P = 0.0003, ****P < 0.0001, two‐tailed unpaired Student's t‐test). c) Flow cytometric analysis of the frequencies of CD25−CD69− cells, CD25−CD69+ cells and CD25+CD69+ cells in CD8+ T cells derived from 6‐week‐old male WT and CKO mice spleen. Antibodies against CD3 (0.1, 0.3, 1.0 µg mL−1) and CD28 (1 µg mL−1) were used to stimulate T cell activation (n = 3 biological replicates, mean ± s.e.m.). d) Flow cytometric analysis of cellular ROS level in CD8+ T cells derived from 6‐week‐old male WT and CKO mice spleen with anti‐CD3 (2 µg mL−1) and anti‐CD28 (1 µg mL−1) antibodies stimulation for indicated time (n = 3 biological replicates, mean ± s.e.m., *P = 0.0148, ***P = 0.0005, two‐tailed unpaired Student's t‐test). MFI, mean fluorescence intensity. e) Splenic CD8+ T cells derived from 6‐week‐old male WT and CKO mice were stimulated with anti‐CD3 (2 µg mL−1) and anti‐CD28 (1 µg mL−1) antibodies for indicated time. Cell viability was measured by Annexin V/7‐AAD staining (n = 3 biological replicates, mean ± s.e.m., ns, not significant (P > 0.05), *P = 0.0111, ****P < 0.0001, two‐tailed unpaired Student's t‐test).