
Figure 6.
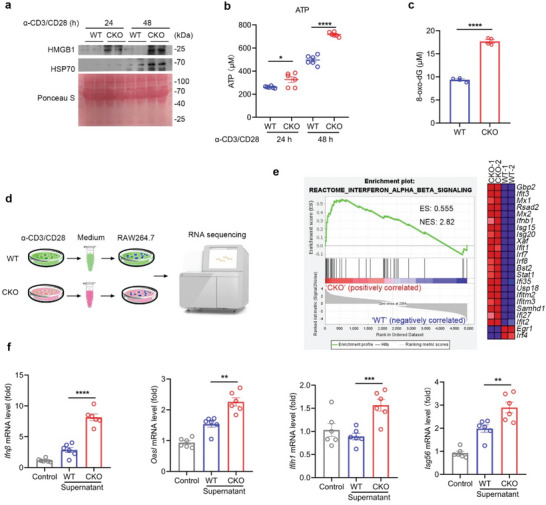
T cell necroptosis by RPA1 deletion provokes host inflammatory response. a) Splenic CD8+ T cells derived from 6‐week‐old male WT and CKO mice were stimulated with anti‐CD3 (2 µg mL−1) and anti‐CD28 (1 µg mL−1) antibodies for indicated time. Cell culture medium was harvested and protein levels of HMGB1 and HSP70 were measured by immunoblot analysis (n = 2 biological replicates). b) Splenic CD8+ T cells derived from 6‐week‐old male WT and CKO mice were stimulated with anti‐CD3 (2 µg mL−1) and anti‐CD28 (1 µg mL−1) antibodies for indicated time. Cell culture medium was harvested and ATP level was measured by ATP detection kit (n = 6 biological replicates, mean ± s.e.m., *P = 0.0231, ****P < 0.0001, two‐tailed unpaired Student's t‐test). c) Splenic CD8+ T cells derived from 6‐week‐old male WT and CKO mice were stimulated with anti‐CD3 (2 µg mL−1) and anti‐CD28 (1 µg mL−1) antibodies for 24 hours. Cell culture medium was harvested and 8‐oxo‐dG level was measured by enzyme linked immunosorbent assay (ELISA) (n = 4 biological replicates, mean ± s.e.m., ****P < 0.0001, two‐tailed unpaired Student's t‐test). d,e) Splenic CD8+ T cells derived from 6‐week‐old male WT and CKO mice were stimulated with anti‐CD3 (2 µg mL−1) and anti‐CD28 (1 µg mL−1) antibodies for 48 hours. Cell culture medium was collected and added to RAW264.7 cell. After 24 h, RAW264.7 cells were harvested and subjected to RNA sequencing d). GSEA of differentially expressed genes in RAW264.7 cells treated with WT or CKO CD8+ T cell culture medium. ES, enrichment score; NES, normalized enrichment score e). f) RT‐qPCR analysis of indicated gene mRNA levels in RAW264.7 cells treated with WT or CKO CD8+ T cell cultures medium (n = 6 biological replicates, mean ± s.e.m., **P < 0.01, ***P = 0.0009, ****P < 0.0001, two‐tailed unpaired Student's t‐test). The primers used for RT‐qPCR have been deposited in Table S1 (Supporting Information).