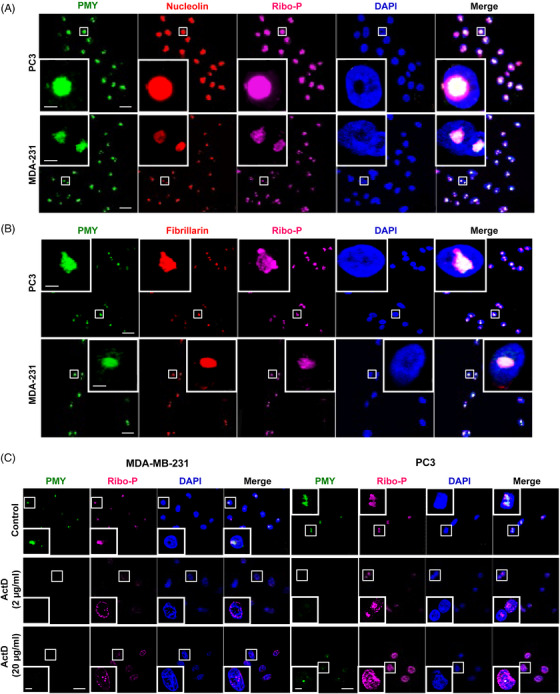
FIGURE 2.

Nuclear translation in the nucleolus. (A, B) Co‐localization of nuclear translation and the nucleolar markers nucleolin (A) or fibrillarin (B) in PC3 and MDA‐MB‐231 cells. Scale bar: 20 µm; inserted magnified view: 5 µm. (C) MDA‐MB‐231 (left panel) and PC3 cells (right panel) were treated with actinomycin D (ActD) and the cells were then subjected to NRPM analysis. Scale bar: 20 µm; inserted magnified view: 5 µm. PMY: puromycin; Ribo‐P: ribosomal P.
