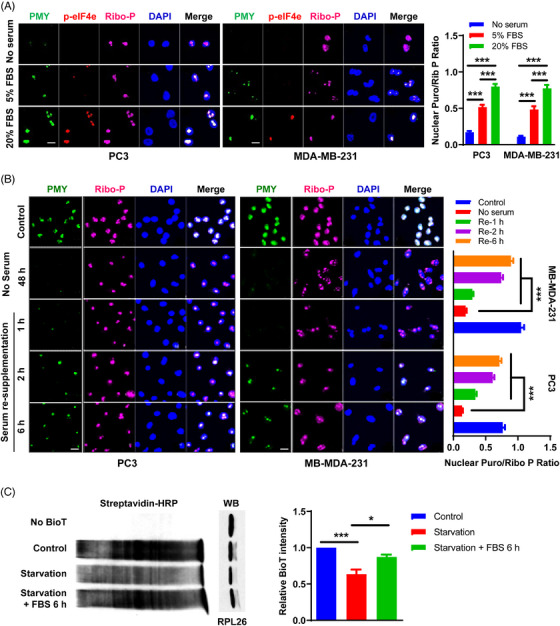
FIGURE 3.

Reduced nuclear translation in malignant cancer cells during serum starvation. (A) PC3 (left panel) and MDA‐MB‐231 (middle panel) cells were cultured with different concentrations of fetal bovine serum (FBS) as indicated, followed by the NRPM analysis. Scale bar: 10 µm. Fifteen fields were acquired for each condition, and the mean fluorescence ratio of PMY/Ribosome P staining for each field was quantitated using ImageJ (right panel). (B) Time‐course experiment of FBS re‐supplementation. PC3 (left panel) and MDA‐MB‐231 (middle panel) cells were serum starvation for 48 h prior to FBS re‐supplementation. Scale bar: 10 µm. Fifteen fields were acquired for each condition, and the mean fluorescence ratio of PMY/Ribosome P staining for each field was quantitated using ImageJ (right panel). (C) Newly synthesized proteins from isolated nuclei of pretreated PC3 cells as indicated were labeled with BioT and detected by western blotting using streptavidin‐HRP (left panel). RPL26 was used as a loading control. Quantification of BioT intensity was shown (mean ± SEM of triplicate experiments) (right panel). Data are shown as mean ± SEM. *p < 0.05, ***p < 0.005. Two‐tailed unpaired t‐test. PMY: puromycin; Ribo‐P: ribosomal P.
