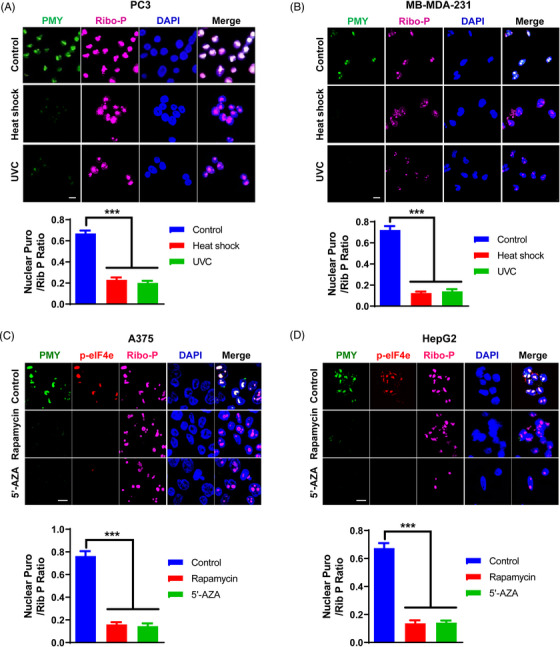
FIGURE 4.

Reduced nuclear translation in malignant cancer cells by growth suppression and anti‐tumor agents. (A, B) PC3 (A) and MDA‐MB‐231 (B) cells were subjected to cellular stresses as indicated, followed by the nuclear ribopuromycylation (NRPM) analysis (upper panel). Scale bar: 10 µm. Fifteen fields were acquired for each condition, and the mean fluorescence ratio of PMY/Ribosome P staining for each field was quantitated using ImageJ (lower panel). UVC: ultraviolet‐C. (C, D) A375 (C) and HepG2 (D) cells were pretreated with rapamycin and azacitidine (5′‐AZA) respectively, followed by the NRPM analysis (upper panel). Scale bar: 10 µm. Fifteen fields were acquired for each condition, and the mean fluorescence ratio of PMY/Ribosome P staining for each field was quantitated using ImageJ (lower panel). Data are shown as mean ± SEM. ***P < 0.005. Two‐tailed unpaired t‐test. PMY: puromycin; Ribo‐P: ribosomal P.
