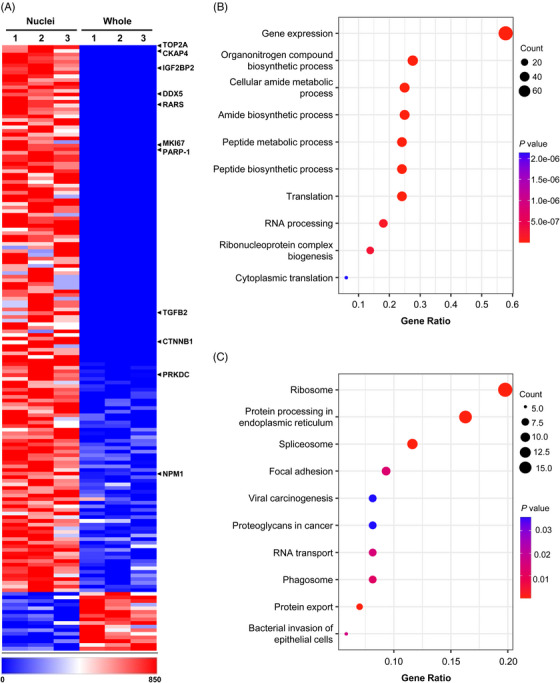
FIGURE 5.

Puromycin‐associated nascent chain proteomics (PUNCH‐P) analysis of PC3 nuclei. (A‐C) Whole‐cell extracts or isolated nuclei of PC3 cells were labeled by BioT. Equal amounts of samples were subjected to LC‐MS/MS analysis. (A) Heat map of newly synthesized proteins with statistically significant differences in PC3 whole‐cell extracts or isolated nuclei (Fold > 1.5, p < 0.05). Red and blue depict higher and lower protein levels, respectively, and color intensity indicates the magnitude of expression differences. Selected NT‐derived oncoproteins are indicated on the right. (B) Gene ontology (GO) analysis on proteins that are enriched in nuclei. (C) KEGG analysis on proteins enriched in nuclei.
