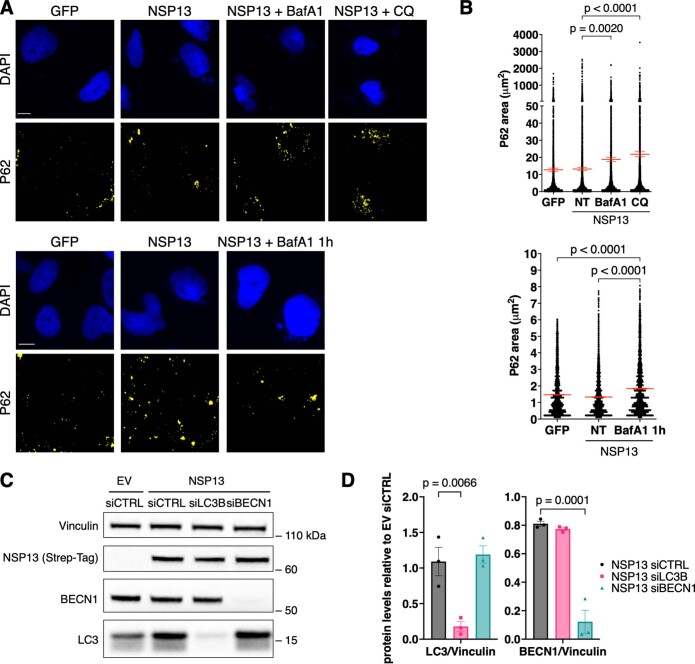
Extended Data Fig. 5. Controls for autophagy experiments.
A) Representative IF images of autophagosome accumulation in Huh7 cells following GFP or viral NSP13 expression and treatment with the autophagy inhibitors BafA1 and CQ. Autophagosomes were visualized by probing for P62; nuclei were stained with DAPI. Scale bar, 10 μm. B) Quantification of the area (μm2) of cytoplasmic P62+ aggregates shown in A. At least 100 cells were scored for each sample. C) Representative immunoblots showing the efficiency of BECN1 and LC3B knock-down in Huh7 cells expressing NSP13; as control, cells were transfected with an EV. D) Quantification of LC3 and BECN1 protein levels shown in C. Values are shown as relative to samples transfected with a non-targeting siRNA and with the EV siCTRL. Vinculin was used as a loading control. Source numerical data and unprocessed blots are available in source data.

