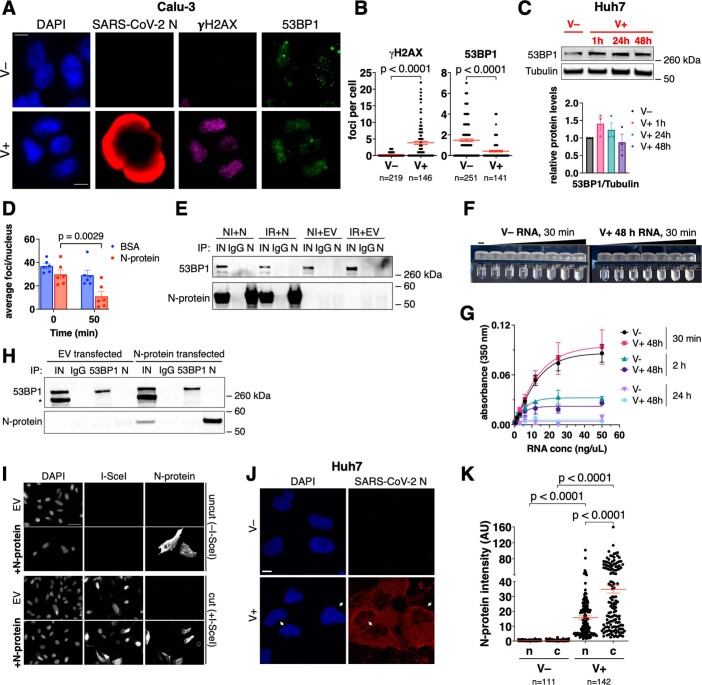
Extended Data Fig. 6. SARS-CoV-2 N-protein impairs 53BP1 foci formation in a RNA-dependent manner.
A) IF images of Calu-3 cells fixed 24 h post-infection; nuclei were stained with DAPI. Scale bar, 10 μm. B) Quantification of DDR foci shown in A; the dot-plots show the number of γH2AX or 53BP1 foci per nucleus; horizontal bars are the means ± s.e.m. of four independent infections. C) Immunoblot of infected Huh7 shown in Fig. 1A; tubulin was used as loading control. The histograms show the quantification of total 53BP1 levels; values are shown as relative to mock-infected samples. D) Quantification of 53BP1 foci per nucleus in irradiated 53BP1-GFP after micro-injection of purified recombinant N-protein or BSA as control (n = 6). E) Protein lysates of Huh7 cells transfected with N-protein or EV, irradiated (IR) or not (NI), were incubated with an anti-N-protein antibody (IP: N) or with normal rabbit IgGs (IgG) and analyzed by immunoblotting for the presence of 53BP1. The experiment was repeated three times with similar results. F) Representative pictures of turbidity assays. G) Analysis of turbidity represented in F; n = 4 independent experiments. H) Immunoprecipitation efficiency of the RIP experiments shown in Fig. 6H,I. Asterisk marks unspecific signal. The experiment was repeated three times with similar results. I) IF images of samples described in Fig. 6J. The experiment was repeated three times with similar results. Scale bar, 50 μm. J) IF images of Huh7 fixed 48 h post-infection and stained for N-protein. Arrows indicate cells with nuclear N-protein signal. Scale bar, 10 μm. K) Quantification of N-protein levels in the nucleus (n) and cytoplasm (c) of the samples described in J. Horizontal bars represent the means ± s.e.m. of a representative experiment of infection. Source numerical data and unprocessed blots are available in source data.

