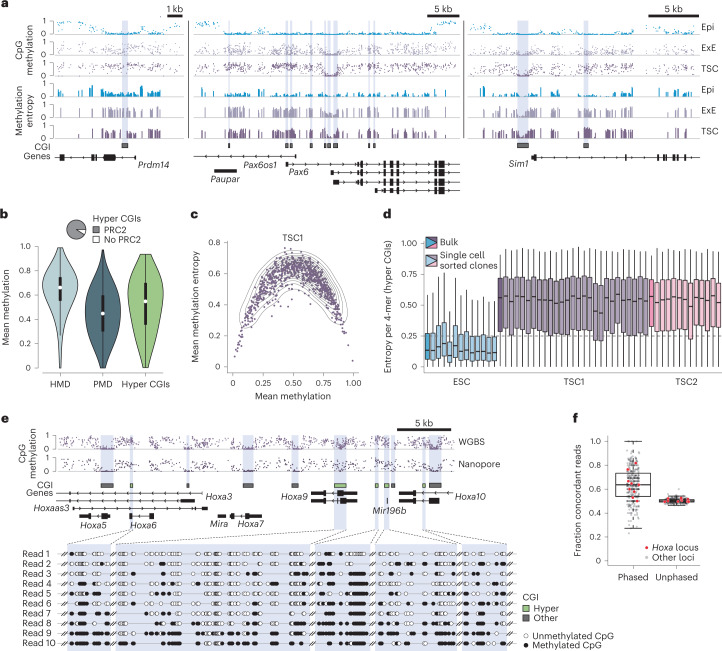
Fig. 1. Dynamic turnover of globally intermediate DNA methylation.
a, Genome browser tracks of CpG methylation and methylation entropy for murine epiblast (Epi), ExE and TSCs. b, Methylation of HMDs (n = 959,249 1 kb tiles), PMDs (n = 954,783 1 kb tiles) and hyper CGIs (n = 1,102) in TSCs (single biological replicate). Pie chart shows the fraction of hyper CGIs targeted by PRC2 in ESCs. White dots denote the median, edges the interquartile range (IQR) and whiskers either 1.5× IQR or minima/maxima (if no point exceeded 1.5× IQR; minima/maxima are indicated by the violin plot range). c, Scatter plot comparing mean methylation entropy and mean CpG methylation at hyper CGIs in TSCs. d, Box plots of methylation entropy per 4-mer (n = 21,952) in hyper CGIs for individual subclones (RRBS data). Each subclone reaches similar entropy levels (low for ESCs, high for TSCs) to in silico generated bulk data. Lines denote the median, edges the IQR and whiskers either 1.5× IQR or minima/maxima (if no point exceeded 1.5× IQR; outliers were omitted). e, Top: genome browser track of the Hoxa locus comparing WGBS and long-read data. Bottom: single reads (98 kb average read length) all display intrinsically heterogeneous methylation. Missing CpGs within reads reflect low likelihood of the methylation call (Methods). f, Fraction of concordant reads that span two hyper CGIs (n = 383 CGI pairs, ≥10× coverage). A read is termed ‘concordant’ if CGI pairs are both above or below the median of their unphased values. Coordination between CGI pairs is apparent compared to randomly shuffled, unphased averages. Hoxa locus pairs are marked in red. Lines denote the median, edges denote the IQR, whiskers denote 1.5× IQR and minima/maxima are represented by dots.

