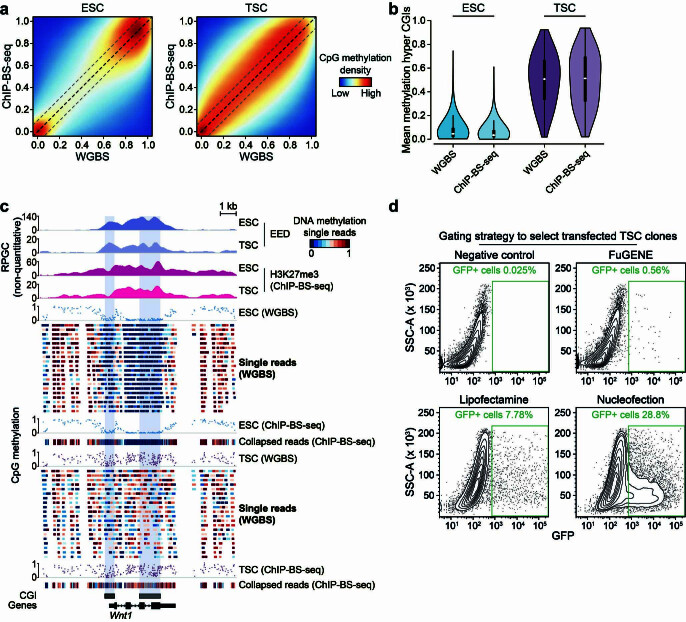
Extended Data Fig. 4. Intermediate DNA methylation and H3K27me3 co-occupy TSC chromatin.
a) CpG-wise comparison of ESCs and TSCs profiled with WGBS and ChIP-BS-seq (n = two merged biological replicates for ChIP-BS-seq and single biological replicates for WGBS). b) Violin plots showing the methylation average of hyper CGIs in ESCs and TSCs as profiled by WGBS and ChIP-BS-seq. The high similarity between WGBS (unenriched background) and ChIP-BS-seq indicates that H3K27me3-modified nucleosomes carry intermediately methylated DNA as a steady state (n = 939 CGIs). White dots denote the median, edges denote the IQR and whiskers denote either 1.5 × IQR or minima/maxima (if no point exceeded 1.5 × IQR; minima/maxima are indicated by the violin plot range). c) Genome browser track of the Wnt1 locus in ESCs and TSCs showing EED localization and H3K27me3 (measured by ChIP-BS-seq) together with DNA methylation measured by WGBS and ChIP-BS-seq. Average methylation of single reads spanning at least three CpGs was visualized for WGBS using IGV (only the first 20 rows are shown). Read-level data expanded for the WGBS samples as a point of comparison for Fig. 3b. d) Gating strategy for selecting transfected clones for the TSC knockout lines. First, cells were gated according to the left panels to enrich for viable single cells, followed by sorting for GFP+ cells. WT TSCs were transfected with corresponding sgRNA/Cas9 plasmids expressing GFP. WT TSCs were used as negative control to set the GFP+ gate.

