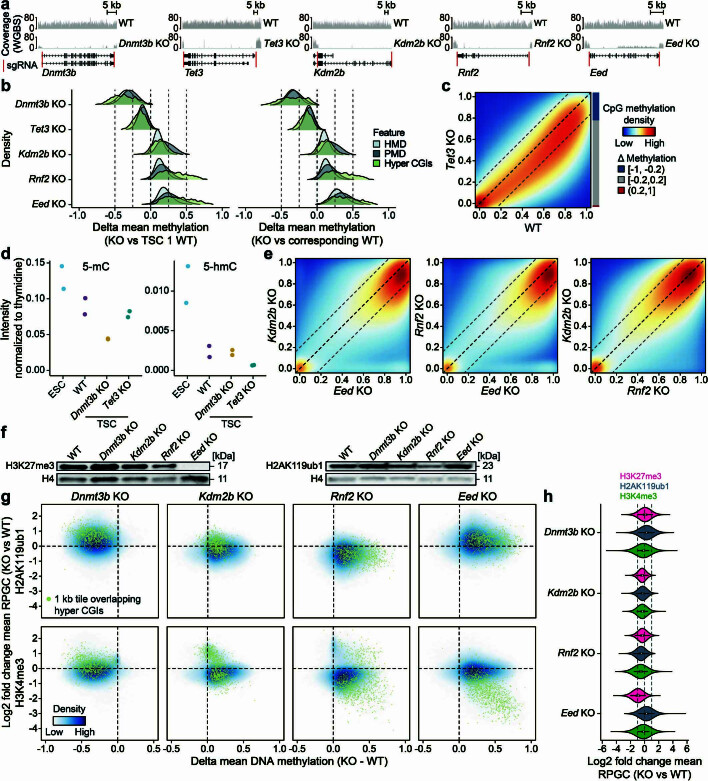
Extended Data Fig. 5. Epigenome-wide shifts following the loss of epigenetic regulators.
a) Verification of the knockout strategy shown by read coverage of WGBS samples. b) Change in methylation for different knockout lines compared to wild type TSCs (left: TSC1, right: matching parental line, single biological replicates). c) CpG-wise density plot comparing Tet3 KO with wild type TSCs show the overall similarity of these methylation landscapes (single biological replicates). d) 5-mC and 5-hmC levels as measured by Mass Spectrometry and normalized to thymidine, shown for ESCs as well as wild type, Dnmt3b KO and Tet3 KO TSCs (n = two independent biological samples, three technical replicates were conducted for each sample and averaged). These results confirm lower levels of both modifications in TSCs compared to ESCs, as well as the dependence of 5-mC on DNMT3B and 5-hmC on TET3. Overall, 5-hmC levels are lower in TSCs in comparison to ESCs even when accounting for lower global methylation levels in general (ratio of 5-hmC/5-mC = 8.7% in ESCs, 2.8% in TSCs). e) CpG-wise density plots comparing Polycomb (PRC) knockout TSCs. Eed KO triggers extreme genome-wide hypermethylation that is more pronounced compared to KOs of core or auxiliary PRC1 subunits (single biological replicates). f) Western blot showing H3K27me3 and H2AK119ub1 in WT and KO TSCs. g) Density plots depicting the relationship between DNA methylation (delta, single biological replicates) and either H2AK119ub1 or H3K4me3 (log2 fold change, three merged biological replicates) as they change between KO and WT TSCS (data is at one kb tile resolution). h) Log2 fold change for each histone modification in all TSC KOs compared to WT (n = 1,700,932 one kb tiles, three merged biological replicates). White dots denote the median, edges the IQR and whiskers either 1.5 × IQR or minima/maxima (if no point exceeded 1.5 × IQR; minima/maxima are indicated by the violin plot range).

