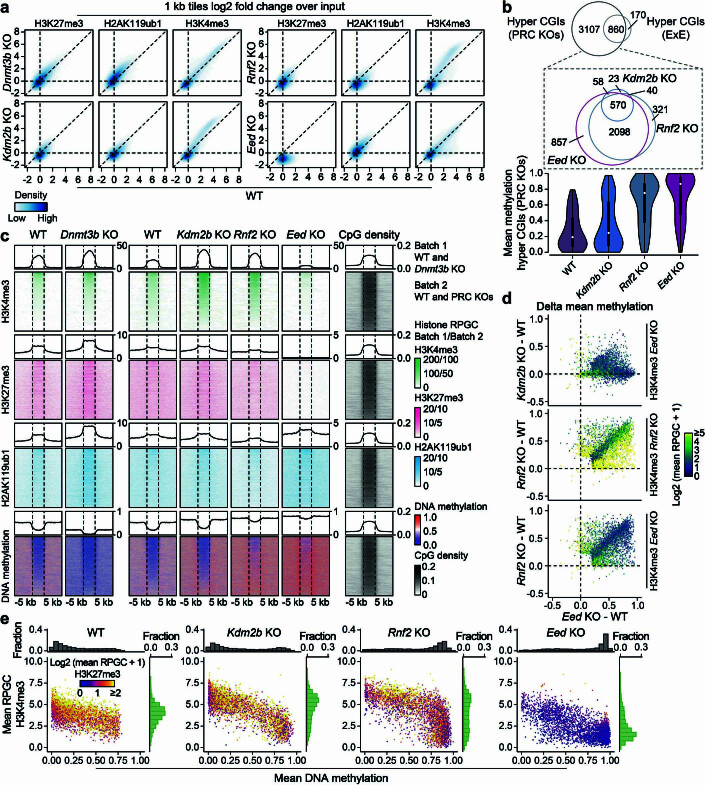
Extended Data Fig. 6. H3K4me3 shields CGIs from extreme hypermethylation.
a) Density plots comparing MINUTE-ChIP signal per one kb tile between WT and KO TSCs (log2 fold change over input, three merged biological replicates). b) Top: Overlap of CGIs hypermethylated in any PRC KO line (difference to WT > 0.2). Kdm2b KO cells show a diminished effect on CGI methylation in comparison to core regulators. Bottom: Mean methylation of the union of hypermethylated CGIs found in any of our PRC KOs (PRC hypermethylated CGIs, n = 3,967). White dots denote the median, edges the IQR and whiskers either 1.5 × IQR or minima/maxima (if no point exceeded 1.5 × IQR; minima/maxima are indicated by the violin plot range). c) Heatmaps of the histone modification and DNA methylation signal at CGIs hypermethylated in PRC KOs (matching the combined metaplots in Fig. 3h). Histone modifications are quantitatively comparable as measured by MINUTE-ChIP within the same batch (Dnmt3b KO and PRC KOs were sequenced in two different batches and therefore each have a separate WT control, see Methods). d) Pairwise scatterplot comparing average delta methylation between PRC KOs with respect to the WT for PRC hypermethylated CGIs. Points are colored by H3K4me3 level in Eed KO (left and right) or Rnf2 KO (mid) (log2-transformed). e) Scatterplot comparing mean methylation and H3K4me3 for PRC hypermethylated CGIs (samples all measured within the same MINUTE-ChIP batch). Histograms show the enrichment of CGIs for DNA methylation (x axis) and H3K4me3 (y axis), respectively. Color represents the average H3K27me3 signal per line (log2-transformed). DNA methylation increases from Kdm2b KO to Eed KO while H3K4me3 signal drops.

