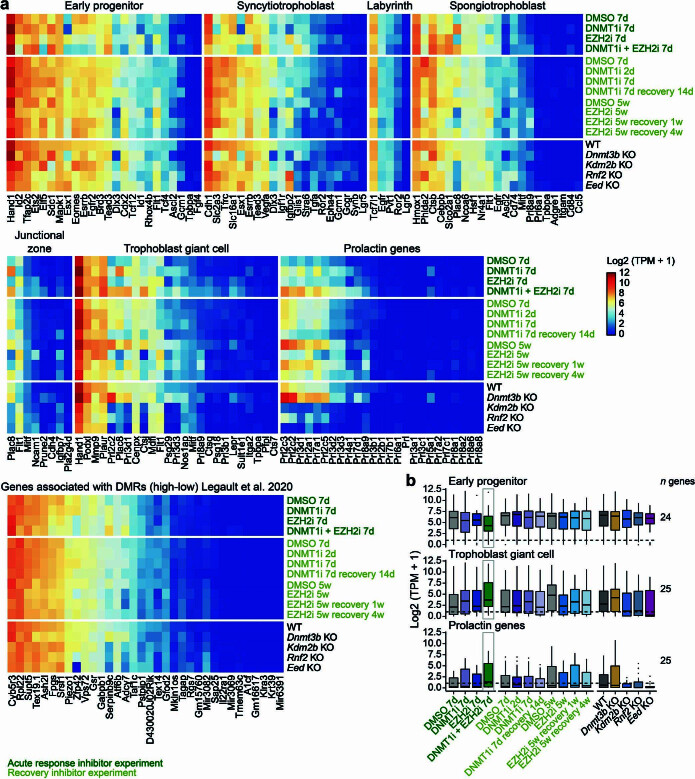
Extended Data Fig. 10. Examining the effects of disrupted epigenetic regulation on placental gene expression.
a) Heatmap of log2-transformed TPMs for marker gene sets specific to different placental cell types, including those associated with early progenitor states (trophoblast stem cells, the ExE and early chorion), as well as for the labyrinth, junctional and giant trophoblast lineages. Marker panels are collected from selected references and include those for the entire prolactin cluster and genes with shared gametogenic and placental functions83–89. Very minimal transcriptional changes are observed across these sets, other than slight downregulation of progenitor markers and upregulation of giant cell markers when both DNA and PRC2 functions are dually inhibited. These signatures could easily be explained by low level spontaneous differentiation induced alongside rapid cell cycle arrest. b) Boxplot of log2-transformed TPMs for marker gene sets that exhibit subtle but notable dynamics, including those for progenitor, trophoblast giant cell and prolactin genes (number of genes indicated in figure panel). Lines denote the median, edges denote the IQR and whiskers denote 1.5 × IQR and minima/maxima are represented by dots.

