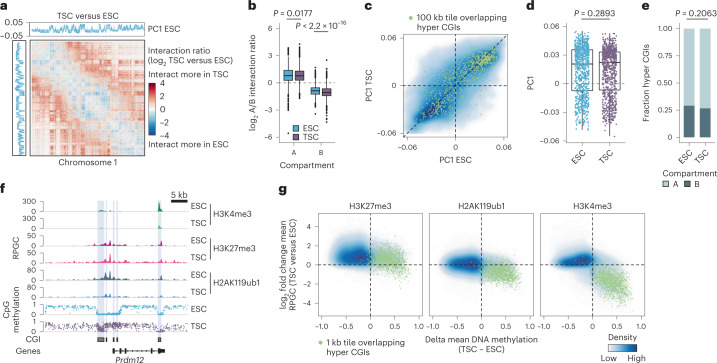
Fig. 2. Global increase of H3K27me3 in TSCs compared to ESCs.
a, Log2 fold change of normalized Hi-C contact frequencies in TSCs compared with ESCs (two merged technical replicates per cell type; this also applies to b–e) on chromosome 1 (100 kb bins). Top and left: first principal component illustrating ESC compartments (A, positive values; B, negative values). b, Box plots of Hi-C A/B compartment interaction ratios per 100 kb bin (n = 23,482 bins, see Methods). The A/B interaction ratio differs significantly between ESCs and TSCs for B compartments (two-sided Wilcoxon rank-sum test, P = 0.0177 and P < 2.2 × 10⁻¹⁶ for A and B compartments, respectively). However, the overall effect is minimal. Lines denote the median, edges denote the IQR, whiskers denote 1.5× IQR and minima/maxima are represented by dots. c, Density plot comparing PC1 across 100 kb tiles (n = 24,026). Green dots mark tiles overlapping hyper CGIs (n = 833). d, PC1 values for tiles overlapping hyper CGIs (n = 833) do not significantly differ between ESCs and TSCs (two-sided Wilcoxon rank-sum test, P = 0.2893). Lines denote the median, edges denote the IQR, whiskers denote 1.5× IQR and minima/maxima are represented by dots. e, Fraction of hyper CGIs in A and B compartments do not significantly differ between ESCs and TSCs (two-sided chi-squared test, P = 0.2063). f, Genome browser tracks of the Prdm12 locus. In ESCs, unmethylated CGIs are enriched for H3K4me3 as well as for repressive H3K27me3 and H2AK119ub1. In TSCs, CGI methylation increases while H3K4me3 decreases. H3K27me3 spreads further into the flanking regions but remains enriched over CGIs. g, Density plots comparing DNA methylation (delta) and histone modifications (log2 fold change) in TSCs compared with ESCs (1 kb tiles, n = 3 merged biological replicates for each cell type). Globally, TSCs lose genome-wide methylation and gain H3K27me3. In contrast, tiles overlapping hyper CGIs show further H3K27me3 enrichment. Although TSCs tend to subtly increase global H3K4me3 signal, hyper CGIs demonstrate a clear loss. The global enrichment for H3K4me3 appears to correspond to differential retrotransposon regulation (see Extended Data Fig. 3g).

