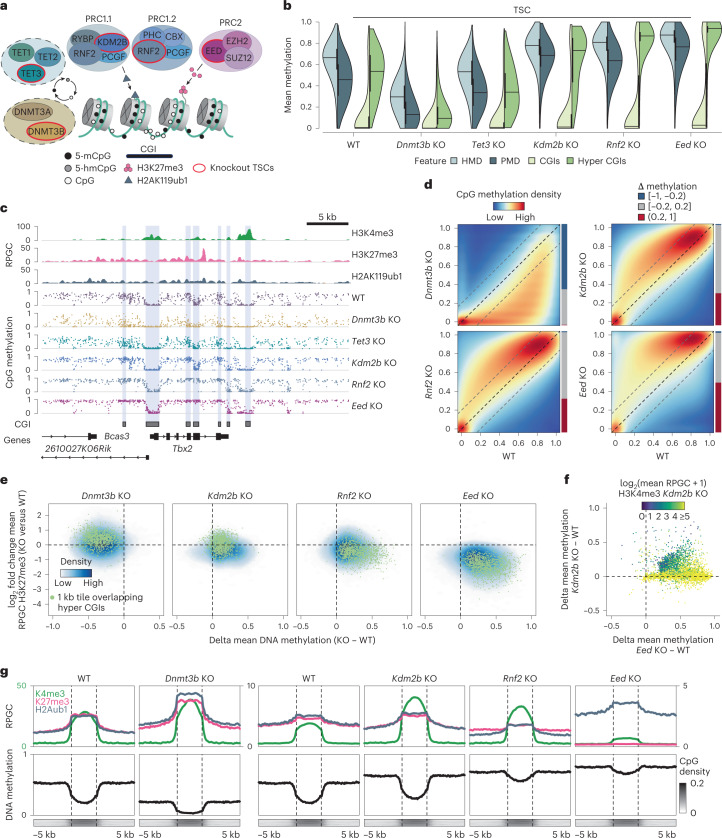
Fig. 4. Intermediate methylation in TSCs depends on opposing DNMT3B and Polycomb activity.
a, Epigenetic repression in embryonic cells. DNMT3A/B deposits DNA methylation whereas TET enzymes promote its removal. PRC 1 and 2 shield developmental gene promoters and recruit each other through their respective modifications. b, Feature-level DNA methylation (1 kb HMDs/PMD tiles, CGIs and hyper CGIs, n = 904,532, 853,972, 14,790 and 1,030, respectively, single biological replicate per condition). Lines denote the median, edges the IQR and whiskers either 1.5× IQR or minima/maxima (if no point exceeds 1.5× IQR); minima/maxima are indicated by the violin plot range. c, Genome browser tracks of the Tbx2 locus. Dnmt3b KO loses methylation, while PRC KOs gain methylation up to 100%. Regions marked by strong H3K4me3 signal are kept constitutively free while regions with low H3K4me3 remain unmethylated in Kdm2b KO. d, CpG-wise comparison of WT and KO TSCs (single biological replicate per condition). Barplots indicate the fraction of CpGs that change by >|0.2| compared with WT. e, Density plots comparing DNA methylation (delta) and H3K27me3 (log2 fold change) at 1 kb tile resolution between KO and WT TSCs (n = 3 merged biological replicates for MINUTE-ChIP data, single biological replicate for WGBS, also applies to f and g). Eed KO loses H3K27me3 accompanied by strong DNA methylation gains. f, Scatter plot comparing PRC hyper CGIs (n = 3,849) in Eed KO and Kdm2b KO with respect to WT. Points are coloured by H3K4me3 level in Kdm2b KO (log2-transformed). PRC2 hyper CGIs with high H3K4me3 levels in Kdm2b KO remain unmethylated but gain methylation in Eed KO. g, Metaplots showing the average histone modification enrichment and DNA methylation for WT and KO TSCs at PRC hyper CGIs (respective heat maps are shown in Extended Data Fig. 6c). MINUTE-ChIP enrichment can be quantitatively compared within the same batch (Dnmt3b KO and PRC KOs have separate WT controls, see Methods). Dnmt3b KO exhibits mild H3K27me3 and H2AK119ub1 gain, while both H3K27me3 and H2AK119ub1 are reduced in Rnf2 KO. Eed KO loses all H3K27me3 signal. Enrichment scales are distinct for H3K4me3 (green, left axis) and H3K27me3 or H2AK119ub1 (black, right axis).

