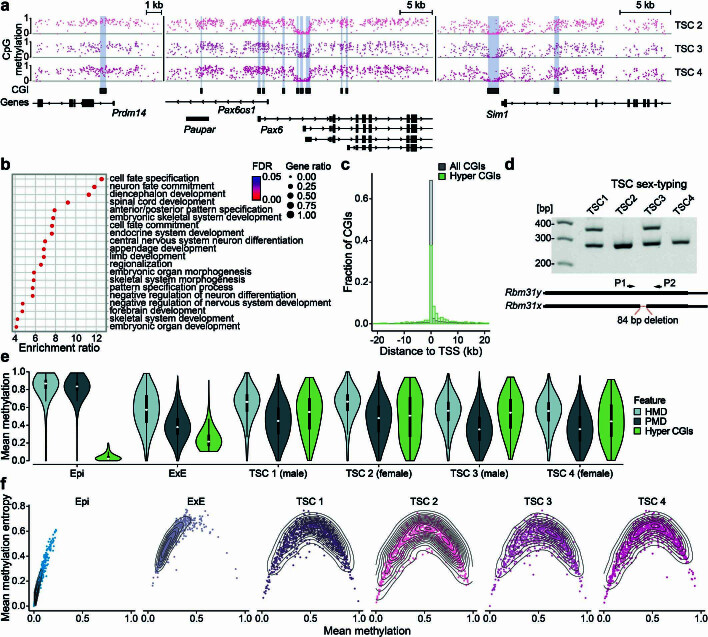
Extended Data Fig. 1. The intermediate methylome is stable and consistent across multiple TSC lines.
a) Genome browser tracks displaying CpG methylation for additional TSC lines. All lines exhibit a global decrease of methylation with select hypermethylation of CGIs to intermediate levels. b) Overrepresentation analysis of genes with hypermethylated CGI promoters in the ExE. Genes are enriched in developmental processes. c) Distribution of the distances to the nearest TSS for all CGIs and CGIs hypermethylated in the ExE. d) Genetic sex determination of wild type TSC lines 1-4 by simplex PCR. Primers differentiate X and Y chromosome homologues of the Rbm31 gene. Rbm31x has an 84 bp deletion in comparison to Rbm31y. Amplicon size: Rbm31x = 269 bp, Rbm31y = 353 bp. e) Violin plots of average HMD, PMD and hyper CGI methylation (n = 959,249, 954,783 and 1,102 features respectively) in epiblast, ExE and all TSC lines (single biological replicates for TSCs, two merged biological replicates for epiblast and ExE). White dots denote the median, edges denote the IQR and whiskers denote either 1.5 × IQR or minima/maxima (if no point exceeded 1.5 × IQR; minima/maxima are indicated by the violin plot range). f) Scatterplot showing the relationship between mean methylation entropy and mean CpG methylation at hypermethylated CGIs in epiblast, ExE and all TSC lines. CGIs are unmethylated in epiblast, which is associated with low entropy. Both ExE and TSC lines exhibit mostly intermediate methylation levels and high entropy (ExE shows comparatively lower intermediate methylation compared to TSCs).

