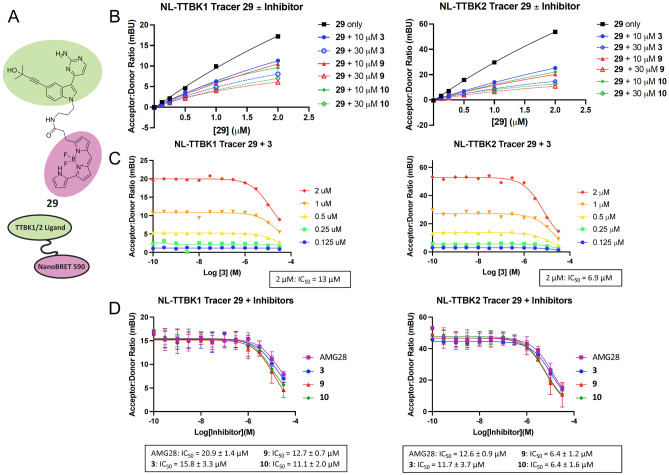
Figure 3.
Cell-based NanoBRET assays with TTBK lead inhibitors. (A) Structure of tracer 29. (B) Competition experiments between tracer 29 and analog 3, 9, or 10 at either 10 or 30 µM for NLuc-TTBK1 and NLuc-TBK2, n = 1. (C) Tracer titration results for NLuc-TTBK1 and NLuc-TTBK2 in the presence of analog 3, n = 1. Calculated IC50 values for 3 are shown for each kinase at the recommended working tracer concentration of 2 µM. (D) Representative NanoBRET assay curves and corresponding IC50 values for active compounds AMG28, 3, 9, and 10 in intact HEK293 cells, n = 2. Error is shown and reported as standard error mean (SEM).

