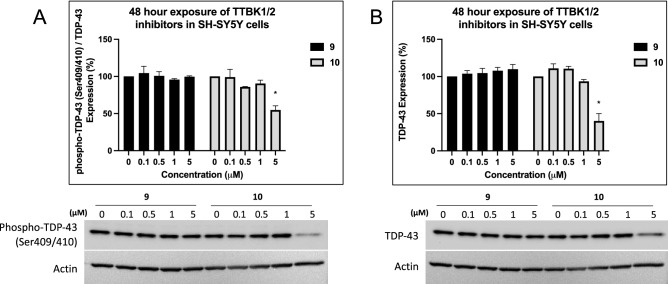
Figure 4.
Effects of TTBK lead inhibitors on downstream signaling. (A) Western blot analyses of SH-SY5Y cells after 48 h treatment with 9 or 10. Quantification of phospho-TDP-43 (Ser409/410, normalized to total TDP-43), n = 3. *control versus 5 µM 10 p-value = 0.0017. (B) Western blot analyses of SH-SY5Y cells after 48 h treatment with 9 or 10. Quantification of total TDP-43, n = 3. *control versus 5 µM 10 p-value = 0.0001. Error bars represent SEM. P-values were generated using one-way ANOVA with Tukey correction. Unformatted images of blots are included in Fig. S8.

