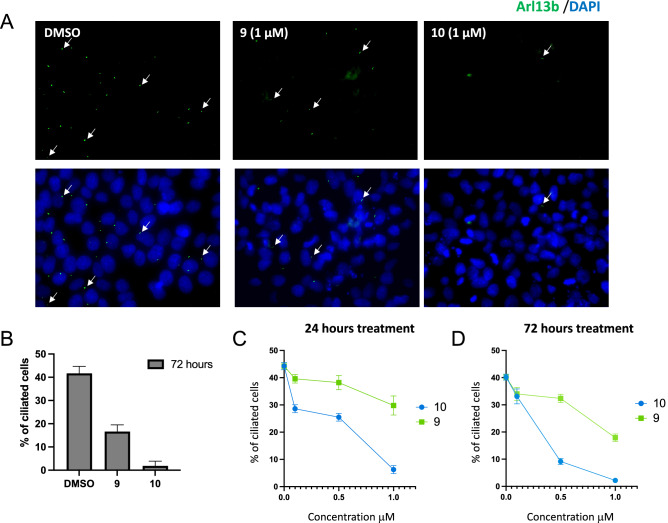
Figure 5.
Images and quantification of cilia following treatment of human iPSCs with 9 or 10. (A) Visualization of cilia on human iPSCs following 72 h continuous starvation and treatment with DMSO or 1 μM of either 9 or 10 at 40 × magnification. Arrows are used to highlight the location of some cilia in each panel and a legend of the stains used to visualize cilia and nuclei is placed above the panels. Primary cilia are labeled with the Arl13b antibody (green) and the nuclei with DAPI (blue). (B) Quantification of the percentage of ciliated cells per single field in (A). Error bars represent the SEM. (C, D) Quantification of the percentage of ciliated cells averaged from six random visual fields following 24 h (C) or 72 h (D) of continuous treatment plus starvation and in the presence of different concentrations of 9 or 10. Error bars represent SEM.

