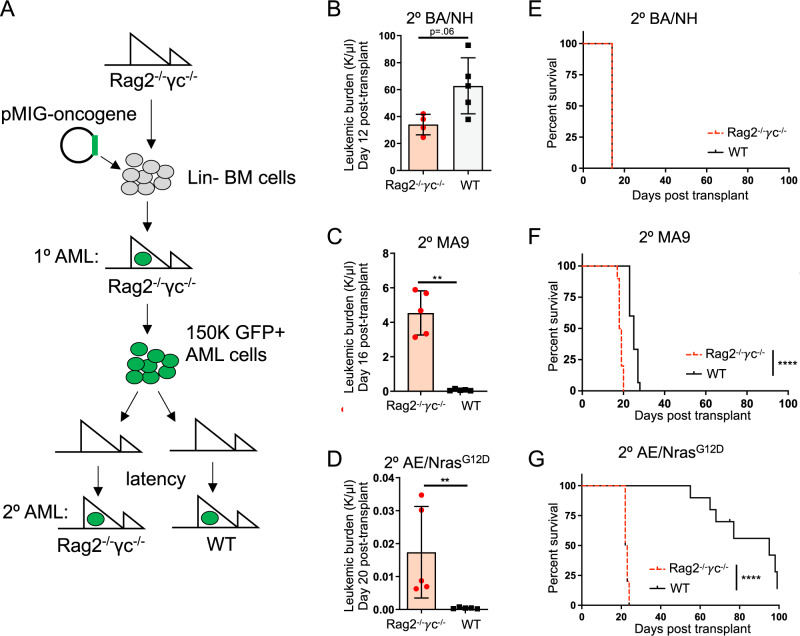
Fig. 1. Oncogene specificity dictates AML immunogenicity.
A Schema for in vivo generation of oncogene-specific retroviral 1o AMLs in Rag2−/−γc−/− mice, then passaged through 2o Rag2−/−γc−/− or wildtype (WT) C57BL/6J mice. Peripheral blood (PB) leukemic burden (WBC × GFP%) of secondary recipients: B BA/NH day 12 post-transplant (n = 4 (Rag2−/−γc−/−), n = 5 (wildtype), p = 0.0635), C MA9 day 16 post-transplant (n = 5, p = 0.0079), D AE/NrasG12D on day 20 post-transplant (n = 5, p = 0.0079). Data are presented as mean values +/− SD, from one of two repeat experiments. Kaplan–Meier curves comparing survival between Rag2−/−γc−/− and WT secondary recipients transplanted with 150,000 1o AML cells demonstrating, E BA/NH (Rag2−/−γc−/− n = 4; WT n = 5; median survival 14 days), F MA9 (Rag2−/−γc−/− n = 10; WT n = 10; median survival 18 vs. 25 days respectively, p < 0.0001) and, G AE/NrasG12D (Rag2−/−γc−/− n = 10; WT n = 10; median survival 22 vs. 95 days respectively, p < 0.0001). BA/NH demonstrating data from one experiment. MA9 and AE/NrasG12D demonstrating pooled data from two experiments. Each point represents a biologically independent animal. Two-sided Mann–Whitney test for comparison between two groups (B–D) and Mantel-Cox test for comparison of Kaplan–Meier curves (E–G). *p < 0.05, **p < 0.01, ***p < 0.001, ****p < 0.0001. Source data are provided as a Source Data file.

