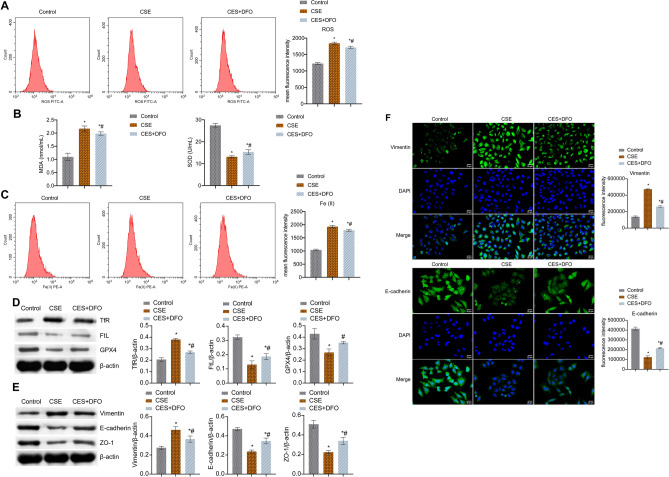
Figure 4.
CSE-induced Ferroptosis promoted oxidative stress and EMT in BECs. (A) FCM detection of ROS content. (B) MDA and SOD levels. (C) The content of catalytic Fe (II) was detected by FCM. (D) The expression of ferroptosis markers TfR, FtL, and GPX4 was utilized by western blot. (E) The protein expression of EMT markers Vimentin, E-cadherin, and ZO-1. (F) IF staining of EMT markers Vimentin and E-cadherin. *P < 0.05 vs. Control, #P < 0.05 vs. CSE. The data were presented in the form of mean ± standard deviation. n = 3.

