Figure 5.
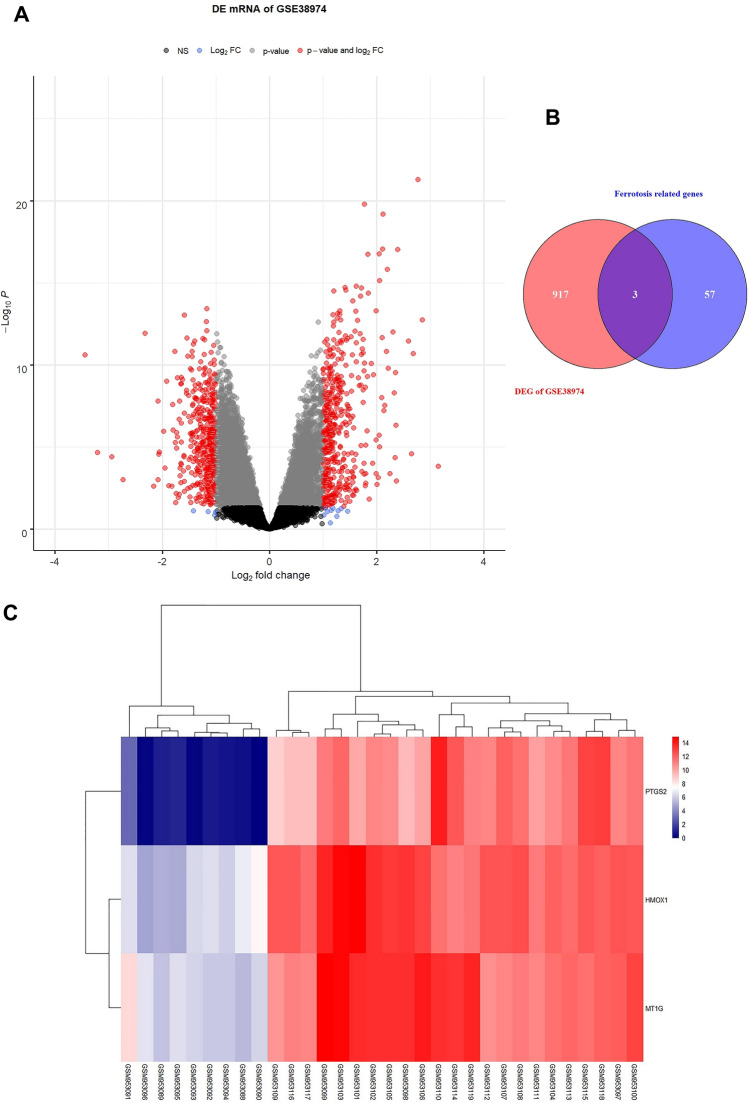
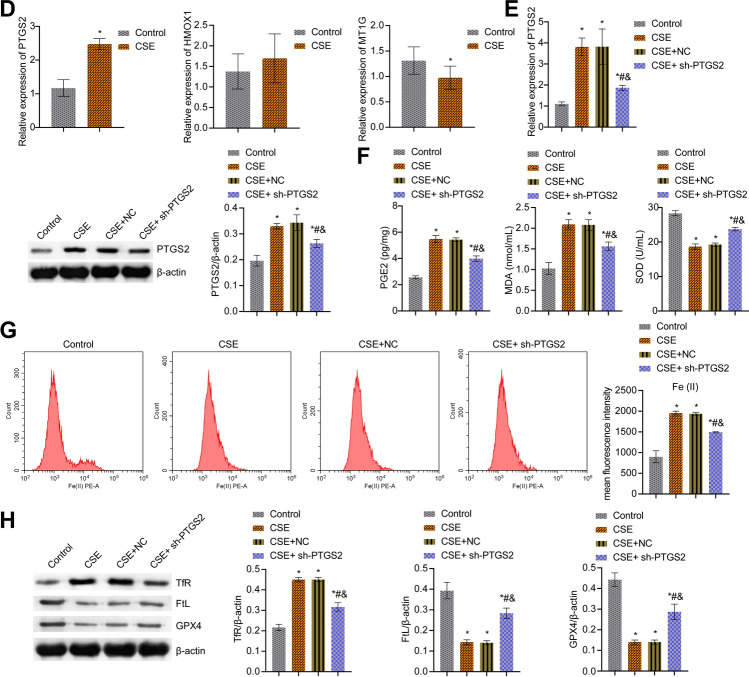
PTGS2/PGE2 signaling pathway affected CSE-induced ferroptosis in BECs. (A) Screening of DEGs. Red dots are differentially expressed mRNAs, and blue dots are stable genes. (B) Venn diagrams of DEGs and ferroptosis-related genes. (C) The cluster heatmap visualization of ferroptosis-related differential genes (drawn with R language). (D) qRT-PCR verification of PTGS2, HMOX1, and MT1G expression. (E) PTGS2 expression was determined by qRT-PCR and western blot. (F) ELISA detection of PGE2, and lipid peroxidation MDA and SOD. (G) The content of catalytic Fe (II) was detected by FCM. (H) The protein expression of ferroptosis markers TfR, FtL, and GPX4. *P < 0.05 vs. Control, #P < 0.05 vs. CSE, &P < 0.05 vs. CSE + NC. The data were presented in the form of mean ± standard deviation. n = 3.


