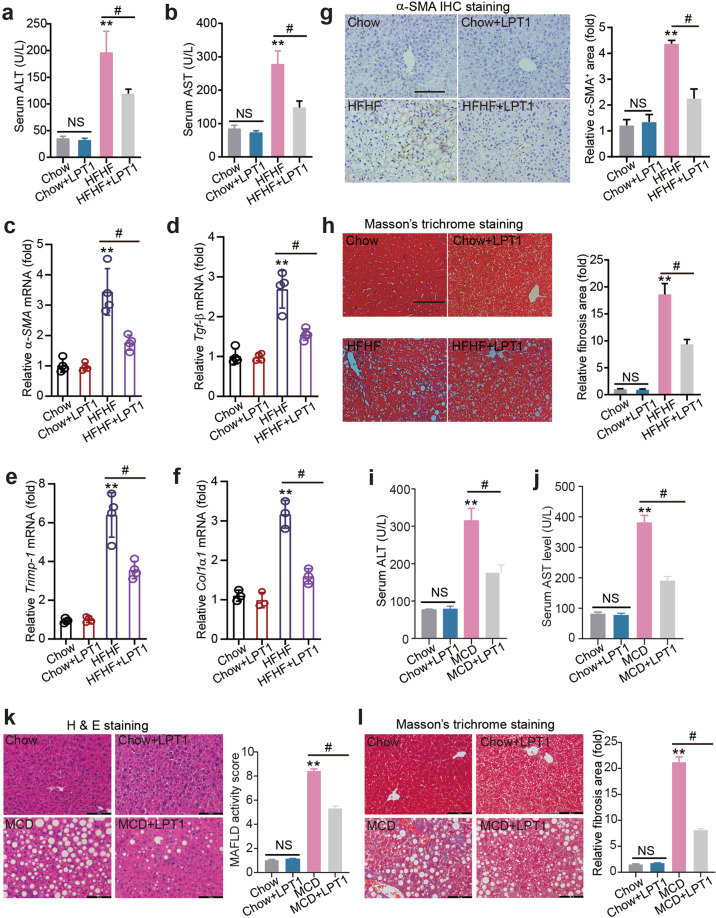
Fig. 3. The ferroptosis inhibitor LPT1 mitigates liver injury and fibrosis in a mouse MAFLD models.
a, b Serum ALT and AST levels in four groups of mice. c–f The mRNA levels of pro-fibrotic genes α-SMA, Tgf-β, Timp-1 and Col1α1 in liver tissues from four groups of mice. n = 4 biologically independent experiments. g Immunohistochemistry staining of α-SMA and quantitative analysis in liver tissues from four groups of mice. Scale bars, 100 μm. h Masson’s trichrome staining showing the collagen fibers (blue) in liver tissues from four groups of mice. Scale bars, 100 μm. i, j Serum ALT and AST levels in four groups of mice fed with MCD for 4 weeks. LPT1 was given intraperitoneally (10 mg·kg−1·d−1) for two weeks. n = 6 per group. k MAFLD activity score calculated based on H&E staining in liver from four groups mice fed with MCD or normal chow diet. Scale bars, 100 μm. n = 6 per group. l Masson’s trichrome staining showing the liver fibrosis from four groups of mice fed with MCD or normal chow diet. Scale bars, 100 μm. n = 6 per group. The data were presented as Means ± SEM and analyzed by One way-ANOVA followed by Tukey’s post hoc test. **P < 0.01 vs Chow; #P < 0.05. NS no significance.

